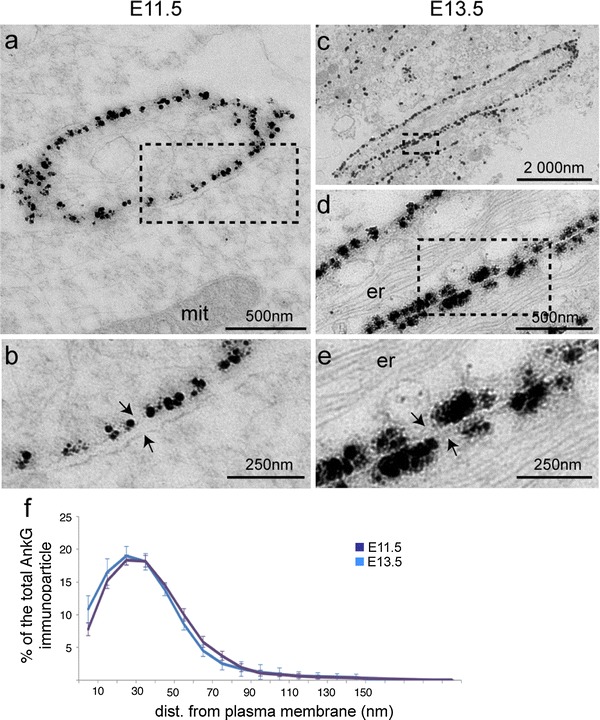
Fig. 4.

Subcellular distribution of AnkG analyzed by electron microscopy revealed a strict sub-membranous localization. a–e Subcellular distribution of AnkG immunolabeling (with rabbit anti-AnkG) in ultrathin sections from E11.5 (a, b) and E13.5 (c–e) ventral spinal cords (arrows in b and e point to the plasma membrane). b, d and e represent an enlargement of dashed boxes in a, c and d, respectively. f Distribution of AnkG immunoparticles with respect to the distance from the plasma membrane at E11.5 (purple curve) and E13.5 (blue curve). No difference could be found between these two stages (two-tailed unpaired t test, p > 0.05, n = 2). mit mitochondria, er endoplasmic reticulum. Scale bar represent 2 μm in b; 500 nm in a, c and 250 nm in b, e
