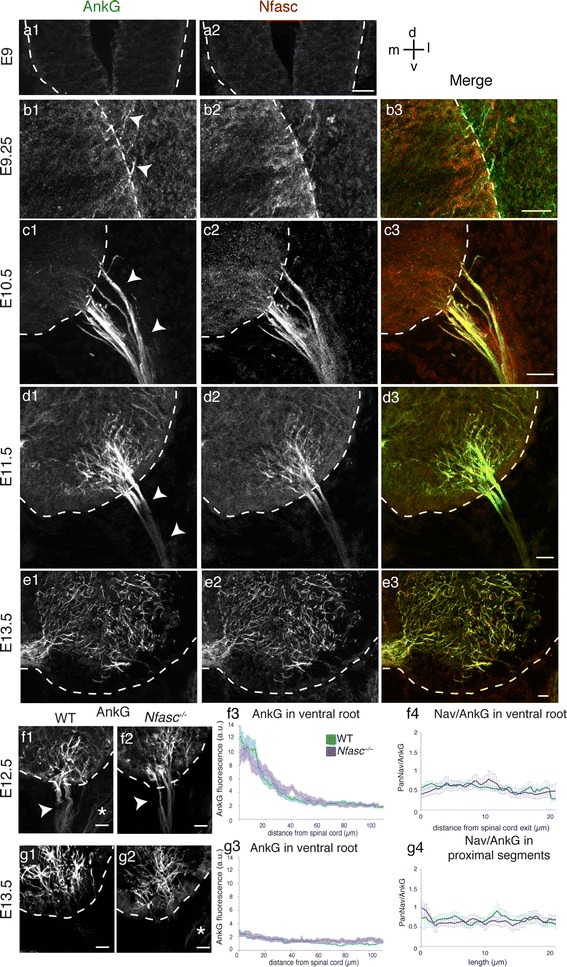
Fig. 6.

Nfasc follows the same spatio-temporal distribution as AnkG, and its loss of expression does not affect the restriction of AnkG and Navs to the nascent AIS. a–e Nfasc (a2–e2) and AnkG (with guinea pig anti-AnkG) (a1–e1) immunolabelings in the ventral spinal cord (delimited with dashed lines) and in the ventral root (arrowheads) at E9 (a), E9.25 (b), E10.5 (c), E11.5 (d), and E13.5 (e). f–g AnkG immunolocalization (with guinea pig anti-AnkG) in the spinal cord and in the ventral root of Nfasc −/− (f2, g2) and WT (f1, g1) embryos at E12.5 (f1, f2) and E13.5 (g1, g2). AnkG IF profile along the ventral root (f3, g3, n = 3) and PanNav/AnkG IF intensities (f4 in the ventral root and g4 within the spinal cord, n = 3; at least 16 paths measured) in WT or Nfasc −/− embryos at E12.5 (f3, f4) and E13.5 (g3, g4). Scale bar represent 25 μm
