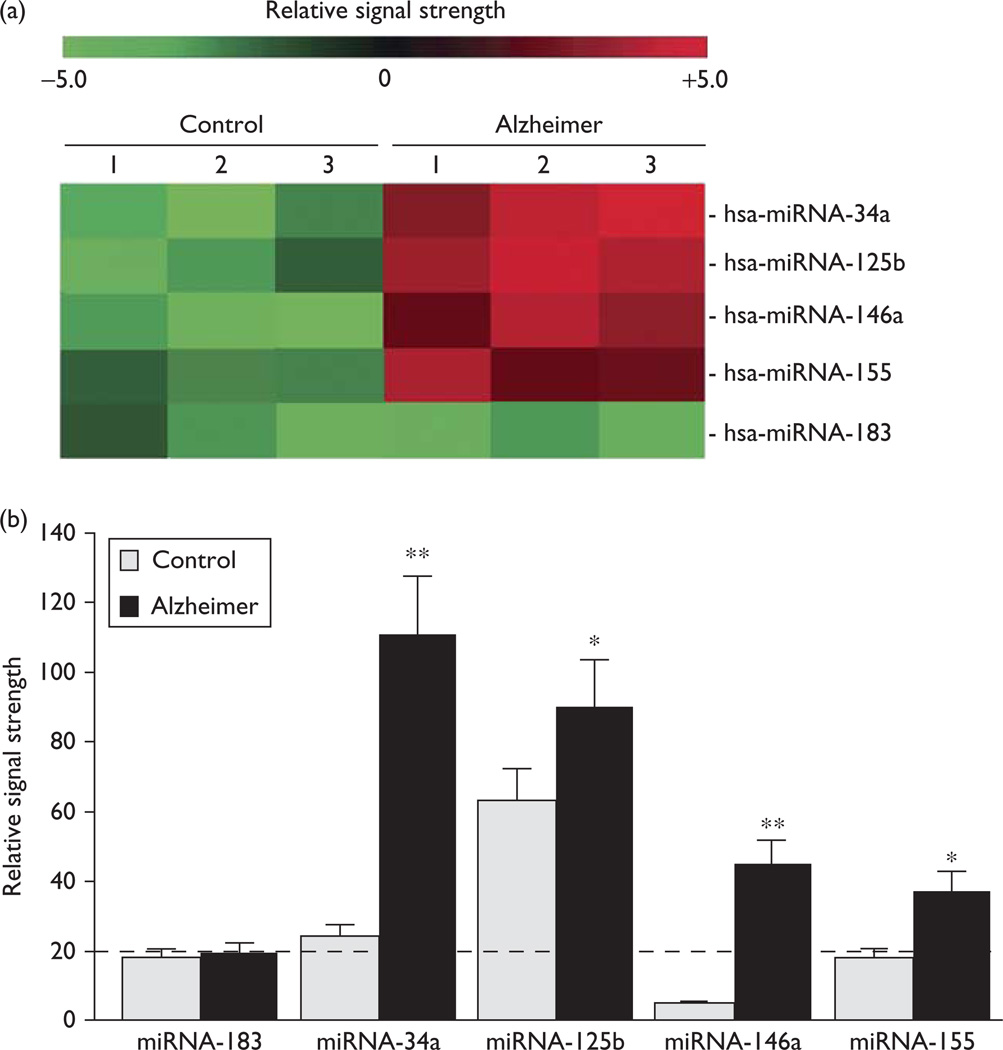
Fig. 1.
Color-coded cluster analysis showing microRNA (miRNA) abundance in human hippocampal CA1. Fluorescent-based miRNA array data for the five most significantly upregulated miRNAs in control and Alzheimer hippocampal CA1 samples are shown in (a); all tissues were obtained from the hippocampal CA1 of the study group (controls N = 3; AD N = 3). There were no significant differences in the age (71.8±4.4 vs. 72.1±5.1 year, P~0.88), PMI (mean 2.0±1.8 vs. 2.0±1.5 h, P~0.94), RNA A260/280 indices (2.08±0.5 vs. 2.05±0.4, P~0.95), or RNA 28S/18S (1.48 vs. 1.44, P~0.95) between the age-matched controls and brain samples of Alzheimer patients, respectively. The RNA integrity numbers (RIN) ranged between 8.0 and 9.0. No significant differences in total RNA yield between the control and Alzheimer samples were noted; (b) similar results were obtained from an LED-northern dot blot assay [1,19]: the dashed horizontal line at 20.0 indicates control miRNA-183 signal in Alzheimer’s disease for the ease of comparison; miRNA-183 is an unchanging control miRNA that has been used as an internal control in previous studies [14,19]; miRNAs were analyzed by LC Sciences (Houston, Texas, USA) using miRNA array panels containing 1898 individual human miRNA targets. Interestingly, miRNA-34a, miRNA-125b, miRNA-146a, and miRNA-155 have each been previously characterized as being inducible, NF-κB-regulated miRNAs; *P<0.05; **P<0.01 (analysis of variance) [8–16].

