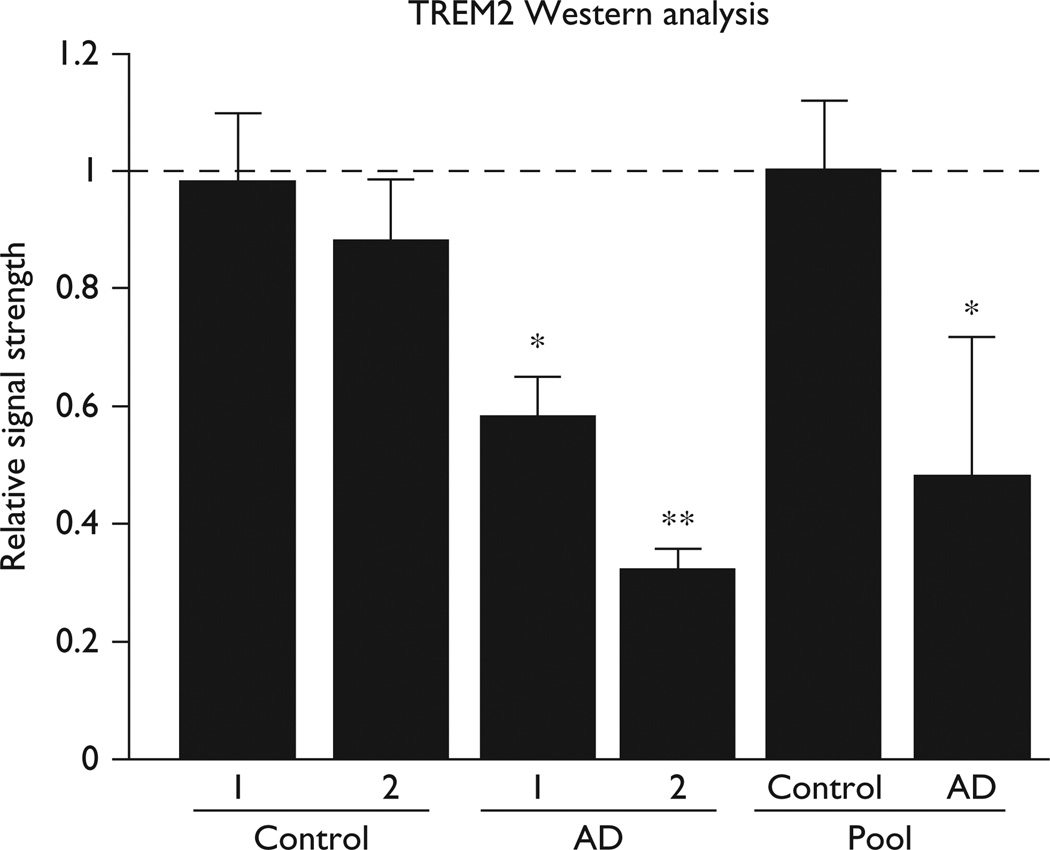
Fig. 3.
Western analysis in control and AD hippocampal CA1. Quantitation of levels of the 25.4 kDa TREM2 protein compared with the 42.2 kDa β-actin (ACTB; 374 amino acids) in the same sample; the highest abundance of TREM2 was found in the hippocampal CA1 at levels about 5 × more abundant compared with the neocortex; the two controls and two AD samples are obtained from short PMI tissues having a PMI of 2 h or less (further described in the text and legend to Fig. 1); results using TREM2 antibody [sc-373828 shown; the pools of control (N = 9)] and AD (N = 12) were derived from pooled whole brain extracts of short PMI tissues having a mean PMI of ~2 h; age range 66–74 for control and AD samples; TREM2 protein levels in AD samples and pools ranged between 0.32 and 0.58 of controls; *P<0.05; **P<0.01 (analysis of variance) [8–16]. AD, Alzheimer’s disease; PMI, postmortem interval.

