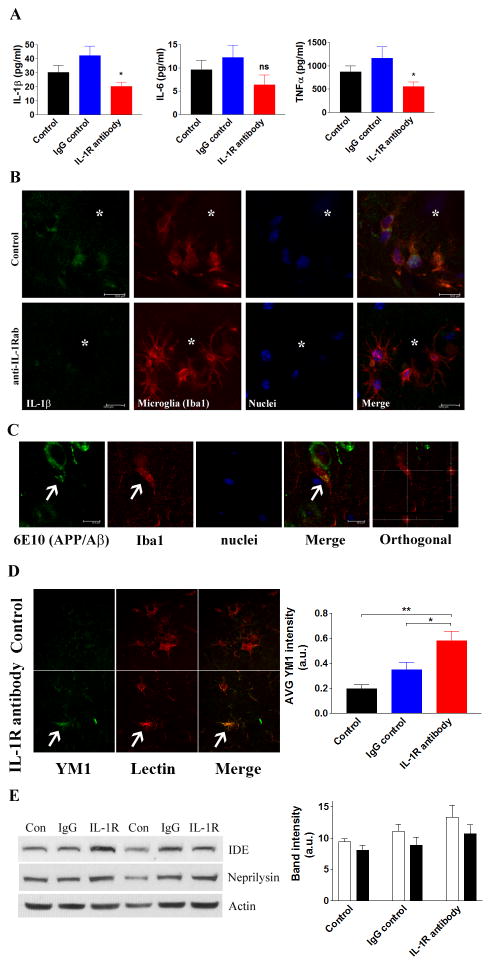
Figure 3. Blocking IL-1 signaling decreases pro-inflammatory cytokines and enhances microglial phagocytosis.
(A) ELISA analysis of selected pro-inflammatory cytokines. Each bar is expressed as mean ± S.E.M. (n=10 for control and IgG control, and n=8 for anti-IL-1R treatment), and *p<0.05 compared to control and IgG control groups. (B) IL-1β levels are decreased in animals receiving the anti-IL-1R blocking antibody. Double immunofluorescent staining with IL-1β and microglia. Asterisks indicate amyloid plaques (scale bar = 10 μm). (C) Suppressing IL-1 signaling promotes the phagocytosis of Aβ by microglia. Representative double-immunofluorescent staining with Aβ (6E10) and microglia (Iba1) in the brain of anti-IL-1R-treated 3xTg-AD mice. Arrows indicate Aβ within microglial compartment (scale bar = 10 μm). (D) Double immunofluorescent staining of YM1 (green) and tomato lectin (red) around Aβ plaques in control and anti-IL-1R antibody-treated mice. Arrow indicates activated microglia with high YM1 expression. YM1 fluorescent intensity was measured and plotted in graph (mean ± S.E.M.). *p<0.05 or **p<0.01 compared to IgG control or control, respectively. (E) Immunoblots and densitometric analyses of Aβ degrading enzymes, insulin degrading enzyme (IDE) and neprilysin in the brain homogenates (n=10 for control and IgG control, n=8 for IL-1R blocking antibody treatment). No statistical significance is detected by densitometric analyses (mean ± S.E.M.).

