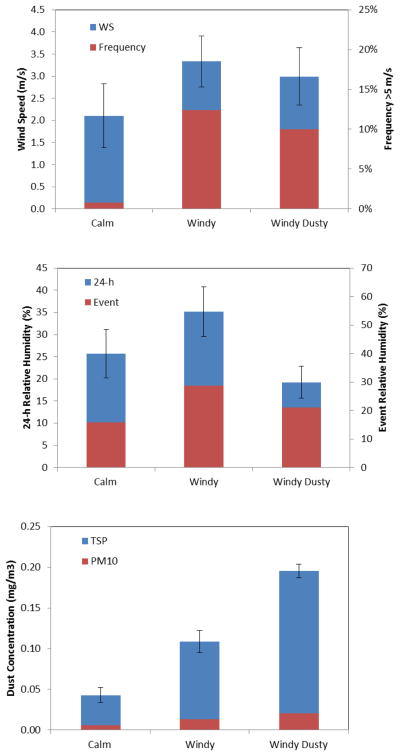
Figure 5.
Wind speed, relative humidity and dust concentration for measurements separated into “Calm”, “Windy”, and “Windy Dusty” events, each containing average of three different measurements, for the Green Valley events. Error bars represent standard deviations of repeat measurements of the same sample.

