3.
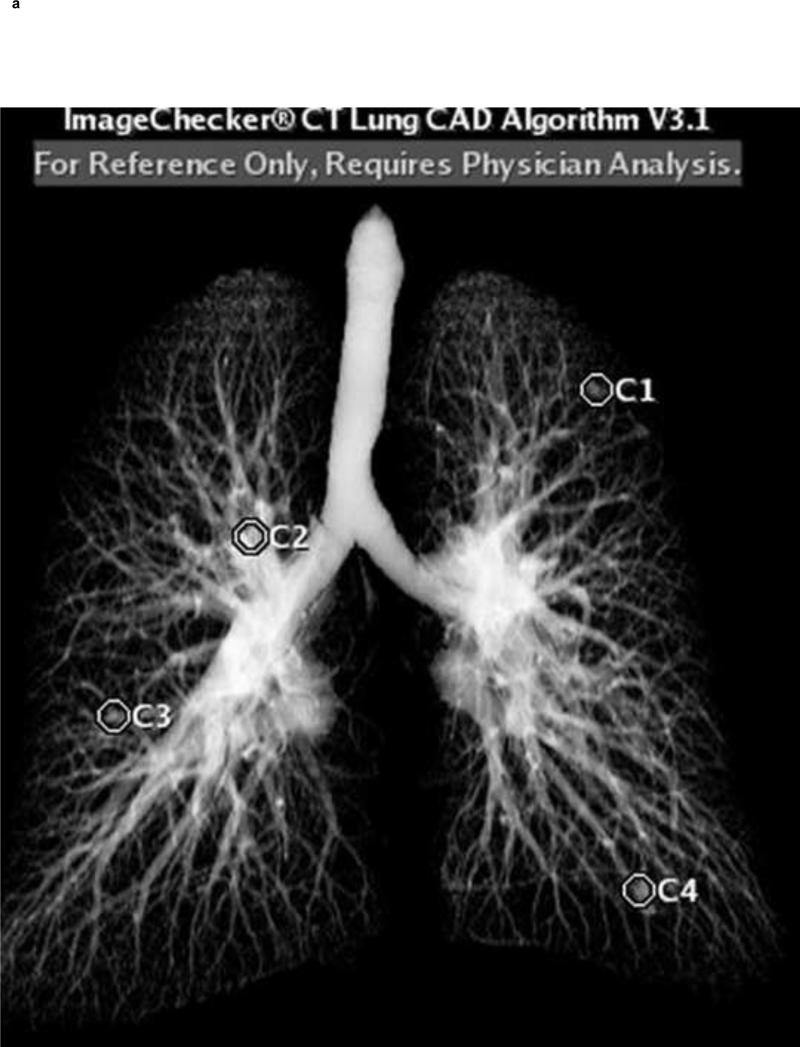
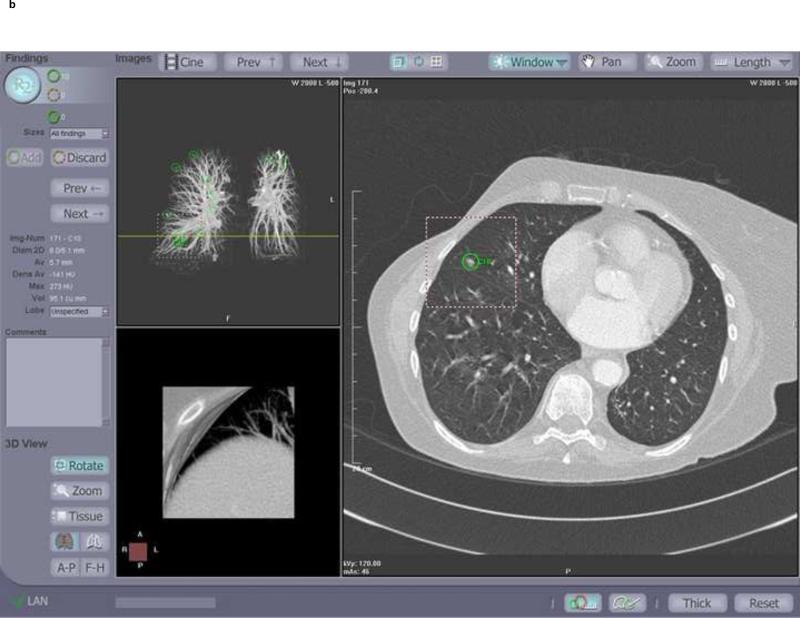
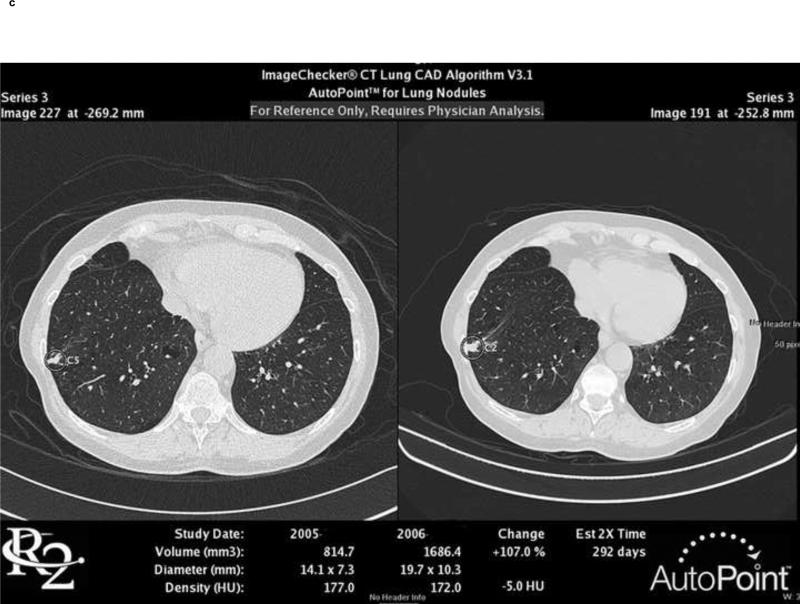
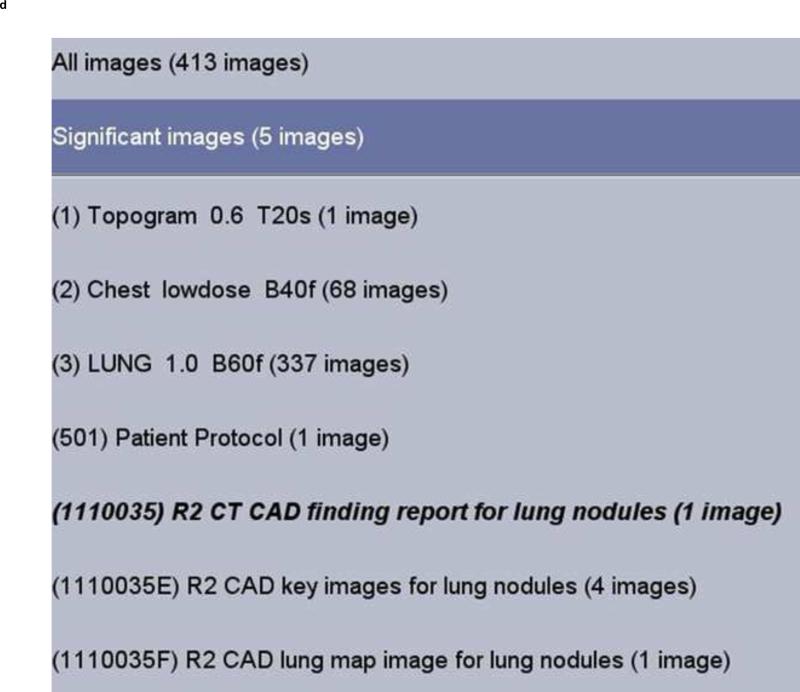
CAD- a sample set of images is provided from a CT Lung Nodule CAD. A volumetric representation is provided indicating where the potential nodules are located (a). Each individual axial section which includes a nodule is also presented (b). The candidate nodule is circled and volumetric and density measurements are provided. If an historical exam is present this system can perform temporal comparisons (c). Each of these images is sent as part of a series to PACS (d). If there are multiple axial images they are included as a single series. A table (report) listing all the nodules is also sent as a series to PACS.


