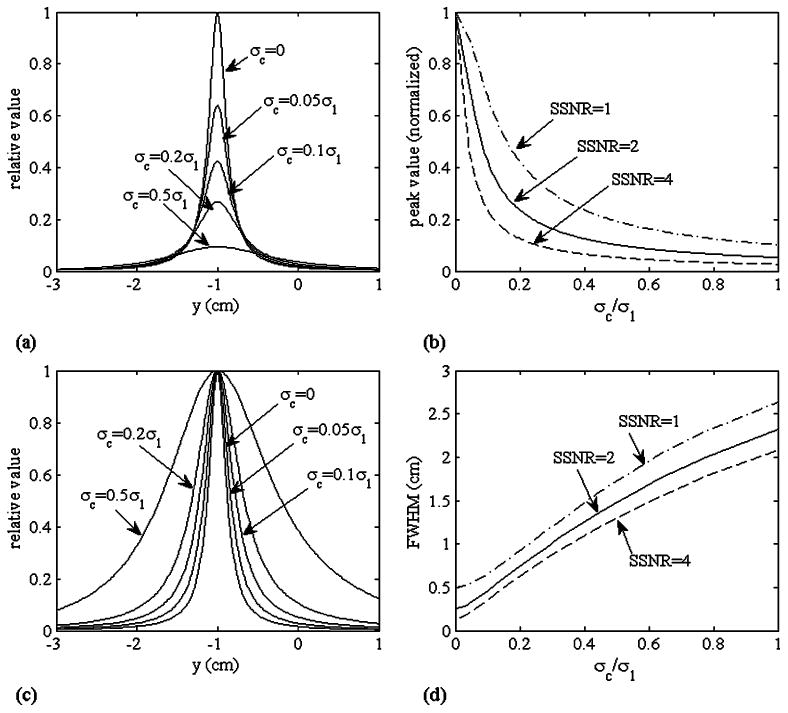
Fig. 2.

(a) Resolution kernels of the upper-left source located at (0, −1, −6) cm. Five values of σc were used: σc = 0, σc = 0.05σ1, σc = 0.1σ1, σc = 0.2σ1, and σc = 0.5σ1. The SSNR, which is defined as , was set to 2. (b) Plot of the peak value of the kernel, , with respect to σc for three SSNR values. (c) The same resolution kernels as shown in (a) in which each kernel is normalized with its peak value. (d) Plot of the FWHM of the resolution kernel with respect to σc for three SSNR values.
