Figure 3.
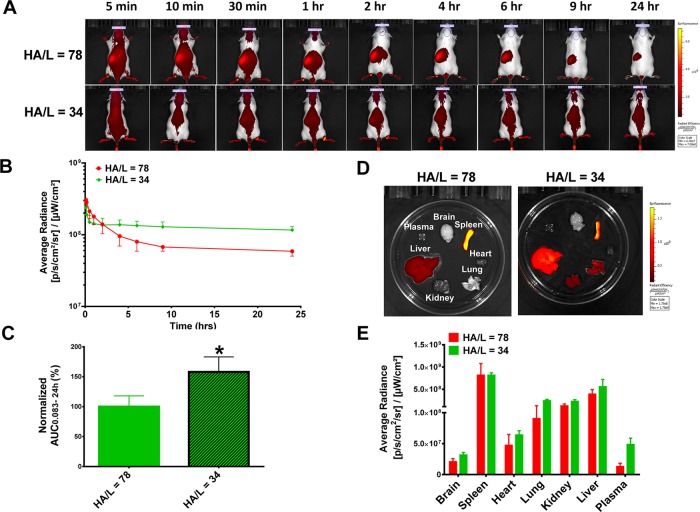
Circulation and biodistribution of DiD-labeled 5–8 kDa HA-liposomes with high (HA/L = 78) or low (HA/L = 34) grafting densities in CD-1 mice. (A) Representative fluorescence images of mice after iv injection of HA-liposomes with high or low HA grafting density liposomes. Images are presented on the same scale. (B) Kinetic curves of fluorescence intensity of mice over time. The average radiance was generated from ROIs drawn at the skull region of mice representing systemic exposure of DiD-liposomes in mice. (C) Average radiance AUC0.083–24h values of liposomes; results were normalized to high grafting density HA-liposomes (100%). (D) Representative ex vivo fluorescence intensities of various organs 24 h postinjection on the same scale. (E) Fluorescence intensity in various organs at 24 h. The average radiance was generated from ROIs drawn on individual organs. *p < 0.05 after Student’s t test. N = 3 mice per treatment group.

