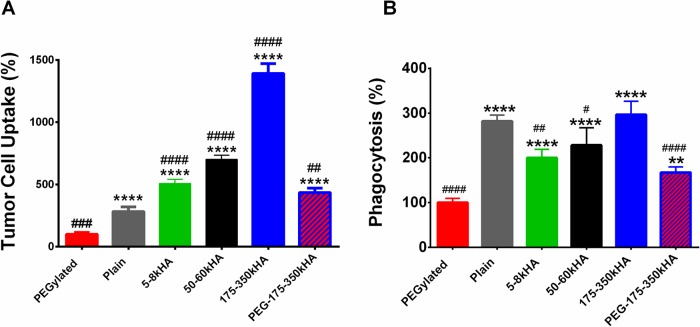
Figure 5.
Quantitative analysis of in vitro tumor cell uptake and macrophage phagocytosis of DiD-labeled liposomes. (A) Cellular uptake of various liposomes in CD44-overexpressing MDA-MB-231 cells. (B) Phagocytosis of various liposomes in THP-1 macrophages. The uptake of liposomes was measured by flow cytometry, and the mean fluorescence was expressed as a percentage of the PEGylated liposomes (100%). **p < 0.01, ***p < 0.001, ****p < 0.0001 significant difference compared to PEGylated liposomes (one-way ANOVA followed by Dunnett’s multiple comparison test). #p < 0.05, ##p < 0.01, ###p < 0.001, ####p < 0.0001 significant difference compared to plain liposomes (one-way ANOVA followed by Dunnett’s multiple comparison test).

