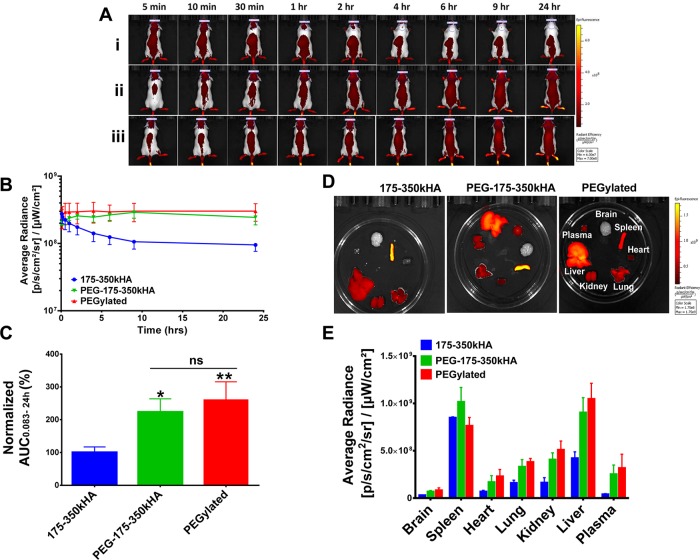
Figure 6.
Imaging analysis of circulation and biodistribution of DiD-labeled PEG-175–350kHA-liposomes in healthy mice. (A) Representative fluorescence images of CD-1 mice after iv injection of 175–350kHA (i), PEG-175–350kHA (ii), or PEGylated (iii) liposomes on the same scale. (B) Kinetic curves of fluorescence intensity of mice during 0.083–24 h postinjection. The average radiance was generated from ROIs drawn at the skull region of mice representing systemic exposure of DiD-liposomes in mice. (C) Fluorescence AUC0.083–24h of DiD-liposomes. The AUC values were generated from the average radiance kinetic curves and normalized to control (100%). (D) Representative ex vivo fluorescence intensities of various organs 24 h postinjection of DiD-liposomes on the same scale. (E) Mean fluorescence intensity in various organs at 24 h. *p < 0.05, **p < 0.01 significant difference compared to 175–350kD HA-liposomes (one-way ANOVA followed by Tukey’s multiple comparison test, ns = not significant). N = 3 or 4 mice per treatment group.

