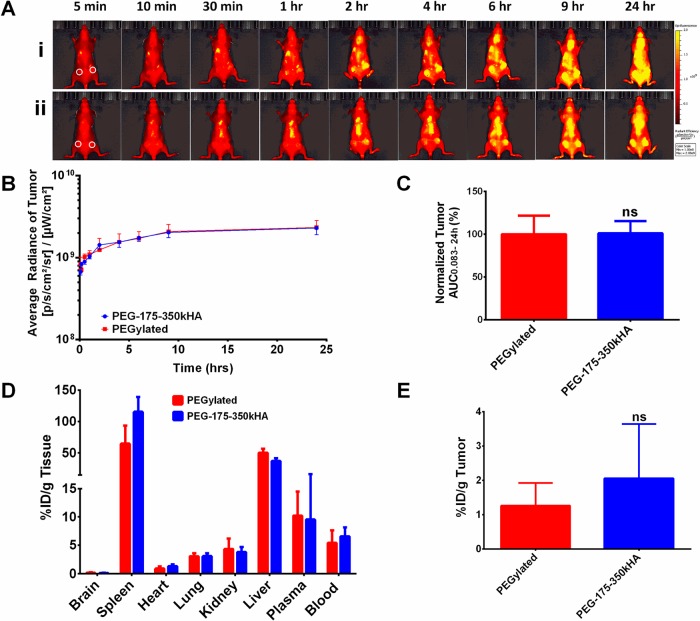
Figure 7.
Tumor accumulation of PEG-175–350kHA-liposomes in MDA-MB-231 xenografts. (A) Representative fluorescence images of mice after iv injection of PEGylated liposomes (i) or PEG-175–350kHA-liposomes (ii) on the same scale. White circles represent subcutaneous tumors on left and right flanks. (B) Kinetic curves of fluorescence intensity of tumor during 0.083–24 h postinjection. The average radiance was generated from ROIs drawn at the tumor region. (C) The tumor fluorescence AUC0.083–24h of DiD-liposomes. The AUC values were generated from the fluorescence kinetic curves and normalized to control (100%). (D) Biodistribution of 3H-liposomes in major organs of MDA-MB-231 xenografts at 24 h. (E) Tumor accumulation of 3H-liposomes in MDA-MB-231 xenografts at 24 h. N = 3 or 4 mice per treatment group; ns = not significant.

