
Figure 9.
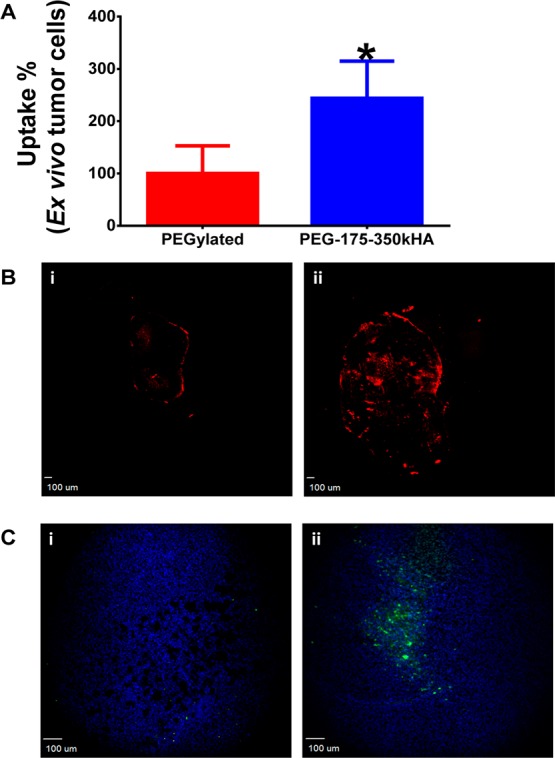
Ex vivo flow cytometry analysis of tumor cellular internalization of liposomes and cleaved caspase-3 staining after liposomal doxorubicin therapy. (A) Ex vivo tumor cellular internalization of DiD-labeled PEGylated liposomes and PEG-175–350kHA-liposomes. The tumor cells were harvested from disaggregated tumor. The internalized formulations were measured by flow cytometry, and mean fluorescence intensity was normalized to control (set as 100%). *Significant difference compared to PEGylated liposomes (p < 0.05, t-test). (B) Distribution of doxorubicin (red) in the entire tumor tissue section (objective = 2×, scale bar = 100 μm) 48 h post iv injection of doxorubicin-encapsulated PEGylated liposomes (i) or PEG-175–350kHA-liposomes (ii). (C) Immunofluorescence staining of cleaved caspase-3 antibody (green) and DAPI (blue) in tumor tissue section (objective = 10×, scale bar = 100 μm) 48 h post iv injection of PEGylated liposomal doxorubicin (i) or PEG-175–350kHA-liposomal doxorubicin (ii).