Fig. 4.

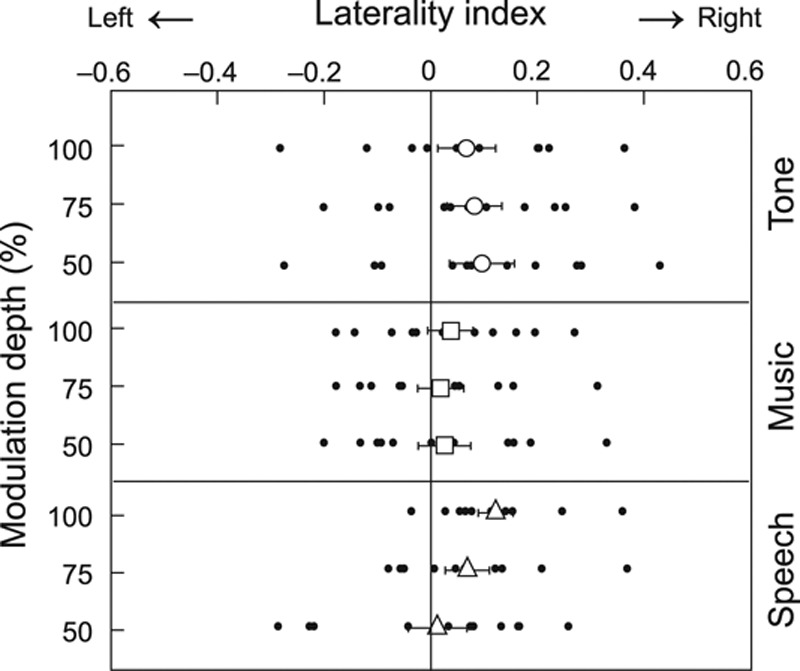
Laterality indices for tone, music, and speech stimuli. Individual indices for stimuli modulated at 50 to 100% are marked with dots, and the mean (± standard error of the mean) values with larger symbols.

Laterality indices for tone, music, and speech stimuli. Individual indices for stimuli modulated at 50 to 100% are marked with dots, and the mean (± standard error of the mean) values with larger symbols.