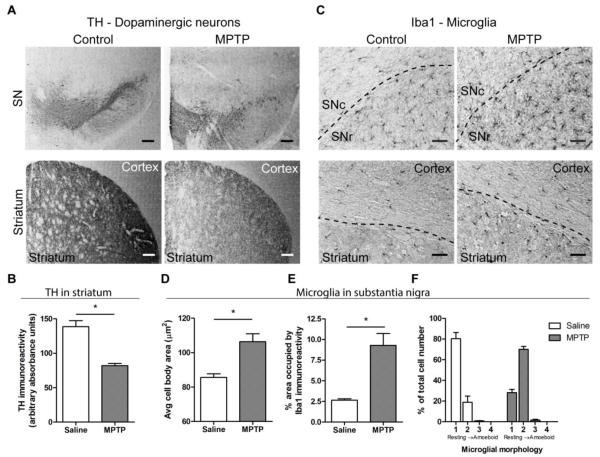
Figure 5. Characterization of MPTP treatment in CX3CR1GFP/+ mice.
CX3CR1GFP/+ mice were treated with 20 mg/kg s.c. MPTP or saline once daily for 5 days, and brains were isolated for immunohistochemistry 5 days after the final MPTP injection. A, Staining of dopaminergic neurons with anti-TH antibody shows decreased immunoreactivity in the SN and striatum after MPTP treatment. Scale bar: 200 μm. B, Quantification of TH immunoreactivity in the striatum. The average absorbance of the TH signal, visualized with DAB staining, is significantly decreased following MPTP treatment. Statistics: two-tailed Student’s t test comparing average signals for each animal. *, p < 0.05. C, Microglia, identified with anti-Iba1 antibody, displayed activated phenotype in the SN and striatum after MPTP treatment. Approximate borders between different brain regions are shown as dashed lines. Scale bar: 50 μm. D-F, Quantification of changes in microglial morphology shows a shift of microglia to a more activated phenotype. The size of microglial cell bodies was determined from thresholded images that displayed only the cell body (D). The area occupied by Iba1 immunoreactivity in the substantia nigra was calculated as the fraction of the image that was occuplied by Iba1 immunoreactivity above a pre-determined threshold (E). To quantify overall morphology, individual cells were assigned phenotypes ranging from resting (score 1) to amoeboid (score 4). The percentage of cells for each morphological phenotype was calculated from all cells examined (F). Figure shows representative slices from 3 saline- and 4 MPTP-treated mice. Statistics: two-tailed Student’s t test comparing average signals for each animal. *, p < 0.05.

