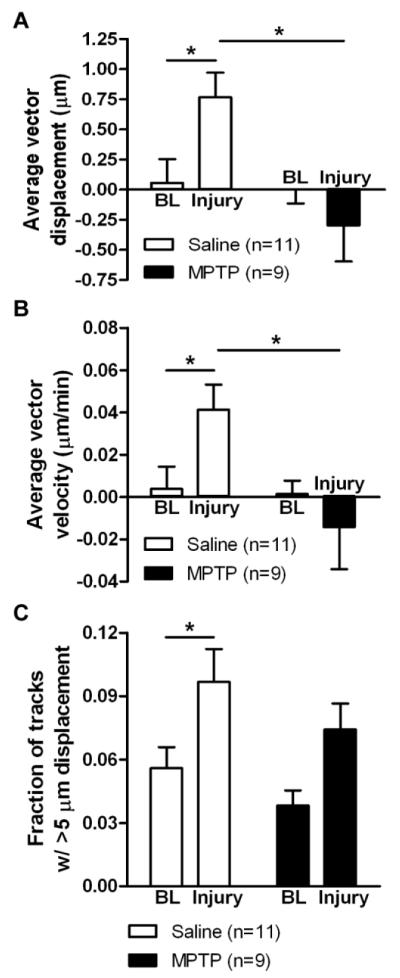
Figure 6. Microglial response to tissue damage in slices from MPTP-treated animals.
CX3CR1GFP/+ mice were injected with 20 mg/kg s.c. MPTP or saline once daily for 5 days, and slices were prepared for imaging 4-7 days later. 2D projections of the optical stacks at each time point were used for analysis by tracking moving objects larger than 2 μm in diameter. The average displacement of all moving objects (A), the mean instantaneous velocity (B), and the fraction of tracks with longer than 5 μm displacement (C) were calculated for baseline (BL) recordings before injury and after the induction of the injury in the same slice. Numbers of slices for each condition are shown in parentheses. Statistics: two-way repeated measures ANOVA and Tukey’s post hoc test. *, p < 0.05.

