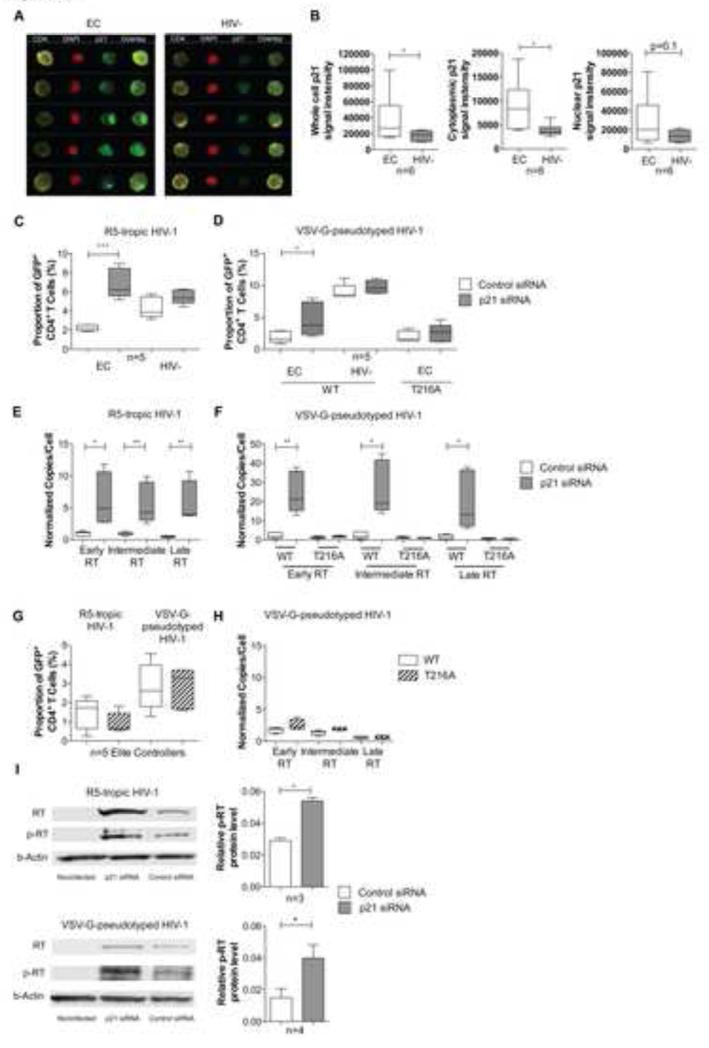
Figure 5. Inhibition of p21 (waf-1/cip-1) increases HIV-1 reverse transcription in CD4+ T cells from elite controllers.
(A): Analysis of the subcellular localization of p21 in CD4+ T cells. PBMCs from Elite controllers or HIV-1 negative patients were stained with antibodies against CD4 (yellow pseudocolor), p21 (green pseudocolor) and DAPI (red pseudocolor) and subjected to ImageStream analysis. Selected images of single-cell analysis plots highlighting differences between an HIV-1 elite controller and an HIV-1 negative patient are shown. (B): Cumulative average p21 signal intensity in CD4+ T cells from Elite controllers (n=6) and HIV-1 negative persons (n=6) in total, cytoplasmic and nuclear compartments of CD4+ T cells. (C/D): Proportion of HIV-1 positive CD4+ T cells from EC and HIV-1 negative persons after ex-vivo infection with R5-tropic or VSV-G-pseudotyped HIV-1 in the presence of siRNA-mediated knock-down of p21. The T216A variant virus was used where indicated. (E/F): Corresponding analysis of early, intermediate and late RT transcripts in CD4 T cells from elite controllers (n=5). (G-H): Comparison of HIV-1 replication patterns of wild-type HIV-1 and the T216A variant in CD4+ T cells from EC. (G) demonstrates proportion of infected CD4+ T cells, (H) reflects levels of early, intermediate and late reverse transcripts. (I): HIV-1 RT phosphorylation in CD4+ T cells after experimental p21 knock-down. CD4+ T cells were transfected with siRNA directed against p21 or control siRNA, infected with R5-tropic or VSV-G pseudotyped HIV-1 and hybridized with antibody against HIV-1 RT, anti-[phospho-210-227] RT or β-actin. See also Figure S4.

