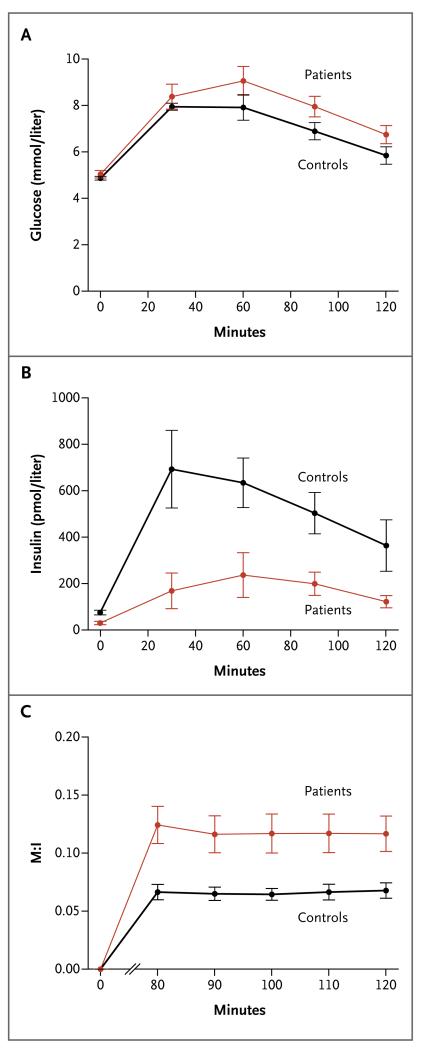
Figure 1. Glucose Tolerance and Insulin Sensitivity from the Oral Glucose-Tolerance Test (OGTT) and Clamp Studies in Five Patients with Loss-of-Function PTEN Mutations and Five Controls.
Panel A and Panel B show the mean glucose and insulin levels, respectively, during an OGTT. Panel C shows the mean M:I ratio from hyperinsulinemic euglycemic clamp studies; the M component (milligrams per kilogram of body weight per minute) was calculated from the mean 20% glucose infusion rate (in milliliters per hour), and the I component was the ambient insulin concentration (milliunits per liter). The data are means across all 15 patients or controls in Panels A and B but across only 5 patients or controls in Panel C. To convert values for glucose to milligrams per deciliter, divide by 0.05551. I bars indicate standard errors.

