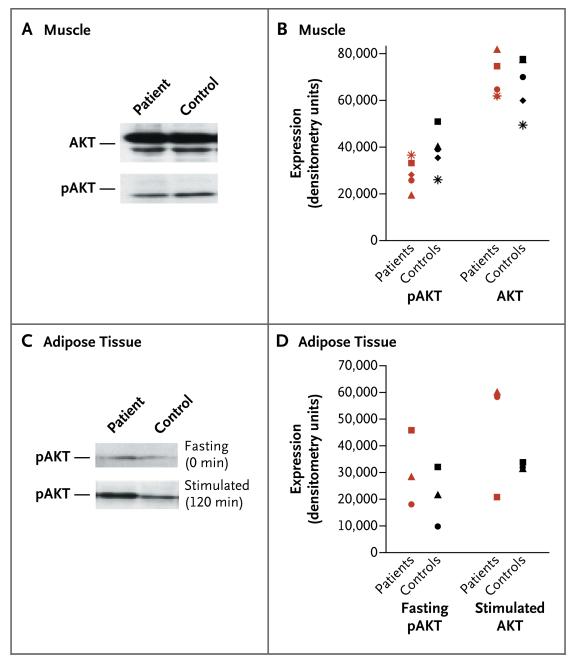
Figure 3. AKT Phosphorylation Status in Muscle and Adipose-Tissue Specimens in Five Study Patients and Five Controls.
Panel A shows a representative blot of relative AKT and phosphorylated AKT (pAKT) levels in muscle tissue from a patient and a matched control, both in a fasting state. Panel B shows the protein expression levels for AKT and pAKT in muscle tissue in five patients and five controls (between-group P = 0.14 for AKT and P = 0.69 for pAKT, by a two-tailed Wilcoxon signed-rank test). Panel C shows a representative blot of relative pAKT levels in adipose tissue from a patient and a control in the fasting state (at 0 minutes) and the glucose-stimulated state (at 120 minutes after the oral glucose-tolerance test was begun). Panel D shows pAKT expression in adipose tissue from three patients and three controls before and after stimulation with glucose (between-group P = 0.11 and P = 0.28, respectively, by a two-tailed Wilcoxon signed-rank test). (The remaining two samples in each group were not analyzed, owing to insufficient material resulting from technical difficulties.)

