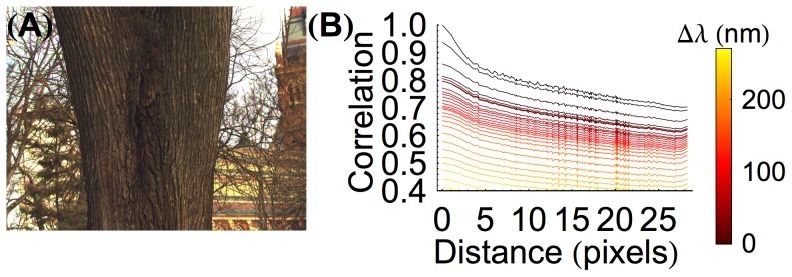
Figure 1. Natural image correlations are highly regular in both space and spectrum.

(A) An RGB rendering of a hyperspectral image taken from the natural image database described by Chakrabarti and Zickler [12]. The code used to render this figure is included in our gitHub repository (https://github.com/DavidBrainard/ReceptorLearning/). (B) Image correlations for images from our combined database. Correlation is plotted as a function of distance (pixel). Each curve represents a different wavelength separation: the black curve represents no wavelength difference while the yellow curve represents a difference of 320 nm (i.e., the 400 nm channel correlated with the 720 nm channel).
