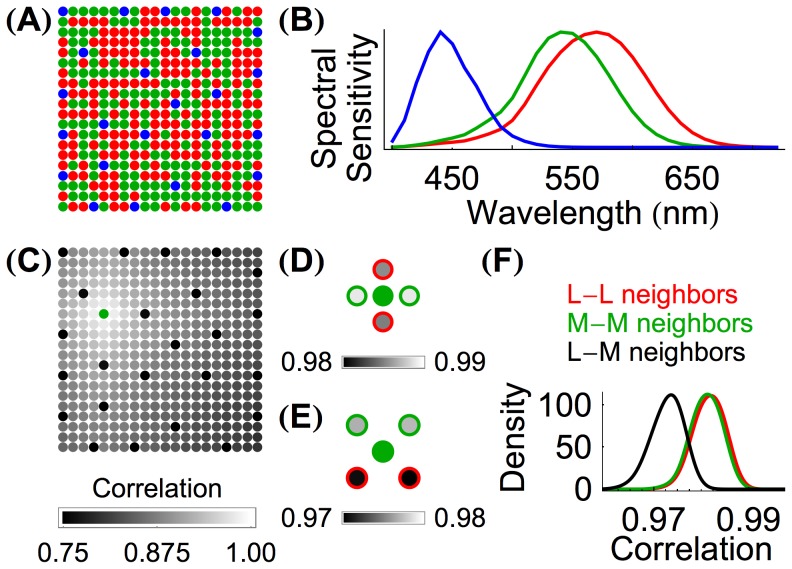
Figure 2. Inter-cone correlations carry information about cone spectral class and mosaic arrangement.
(A) A  cone mosaic with an L∶M∶S ratio of 47∶47∶6; each cone is colored by class (red, green, and blue for L, M, and S cones, respectively). (B) The spectral sensitivities of L, M, and S cones in a typical fovea [52]. (C) The mosaic from Panel A with grayscale indicating the correlation of each cone's response to the response of the single M cone plotted in green. The correlations are calculated from the responses to 2,000,000 natural images. At this scale it is readily apparent that correlations decrease with inter-cone distance and that S cones are distinguished from M cones by their correlations. (D) Magnified view of the correlation of the immediately adjacent neighbors of the green M cone from Panel C, with grayscale indicating correlation. Red and green circles indicate the class of each neighboring cone. Of the four immediate neighbors of the central cone, the two neighboring M cones (green) have higher correlations than the neighboring L cones (red). (E) Magnified view of the correlation of the diagonal neighbors of the green M cone from Panel C, with grayscale indicating correlation. The neighboring M cones have higher correlations than the two neighboring L cones. (F) A smoothed histogram of the correlations of immediately neighboring longer-wavelength-sensitive cones in 54 simulated mosaics whose M cone
  value was 530 nm and whose L cone
  value was 558.9 nm. The 54 mosaics differed in their L∶M cone ratios and sizes. Correlations between neighboring L cones, neighboring M cones, and L-M neighbors are shown in red, green, and black respectively. The histograms represent correlations from 9,862 L-L cone pairs, 9,769 M-M cone pairs, and 8,369 L-M cone pairs.

