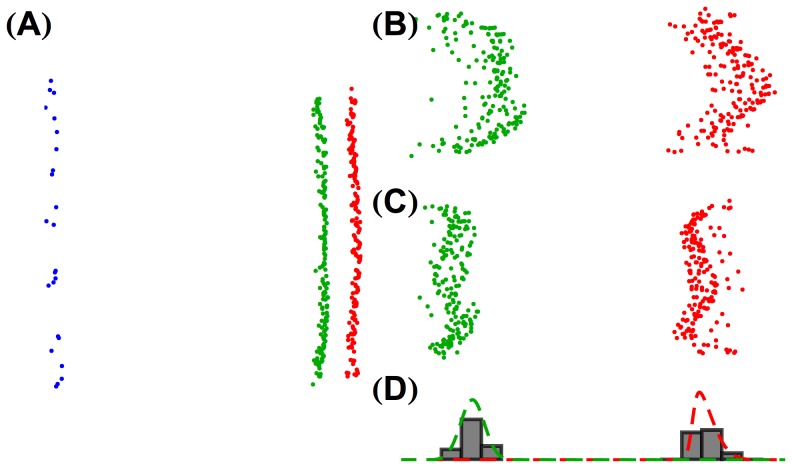
Figure 3. Multidimensional scaling allows classification of cones for a typical trichromatic retinal mosaic.
(A) 3D embeddings of the correlation matrix of the  mosaic from Figure 2A. Each point represents a single cone and is colored red, green, or blue for L, M, or S respectively, according to its actual identity in the mosaic. The 3D embeddings shown here and in other figures in this paper are oriented so that the
  -
- plane (
 horizontal,
  vertical) of the representational space described in the text is shown. The absolute units on these axes are not meaningful, because MDS solutions are determined only up to a relative-distance preserving transformation. (B) The same 3D embedding shown in A zoomed in on the embedding of the L and M cones only. (C) The 3D embedding of the L and M cones from A after flattening. (D) A histogram of the
  positions of the embedding from C (i.e., after flattening); best fit skew normals are shown in red and green. Rotating animations that show the three-dimensional structure of the embeddings are available online (http://color.psych.upenn.edu/supplements/receptorlearning).

