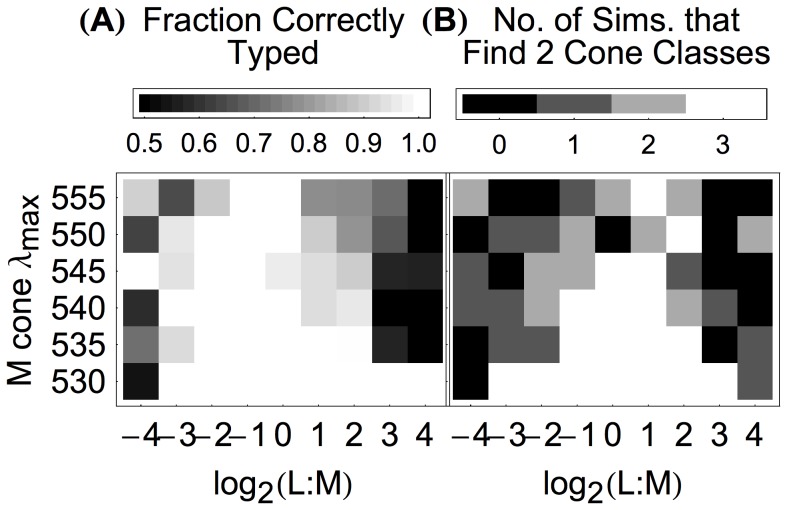
Figure 4. The algorithm detects the number of longer-wavelength-sensitive cone classes and correctly classifies individual cones for a range of trichromatic mosaic parameters.
(A) The fraction of cones correctly classified for various combinations of L∶M cone ratio and M cone  value, when the number of longer-wavelength cone classes (L and M) was assumed to be 2. The S cone proportion was held at 6%, and S cones were given a
  value of 420.7 nm in all simulations. The L cone
  value was 558.9 nm. Each cell in the plot represents the aggregate results of three simulations, each with a different mosaic and each shown a different random sample of 2 million natural image patches. Mosaic responses for each simulation were obtained with different draws of natural image patches. Accuracies are reported as the average accuracy for L and M cones, each calculated separately. For example, if the algorithm correctly classified 354 of 354 L cones and 1 of 22 M cones in a mosaic with an L∶M ratio of 16∶1, the overall accuracy reported here would be 52% (the mean of 354/354 and 1/22) rather than 94% (the fraction of all cones correctly classified). (B) The number of simulations (of three) for each L∶M ratio and M cone
  value where the algorithm correctly detected that there were two longer-wavelength-sensitive cone classes. The results for individual simulations are given in Figure S4.

