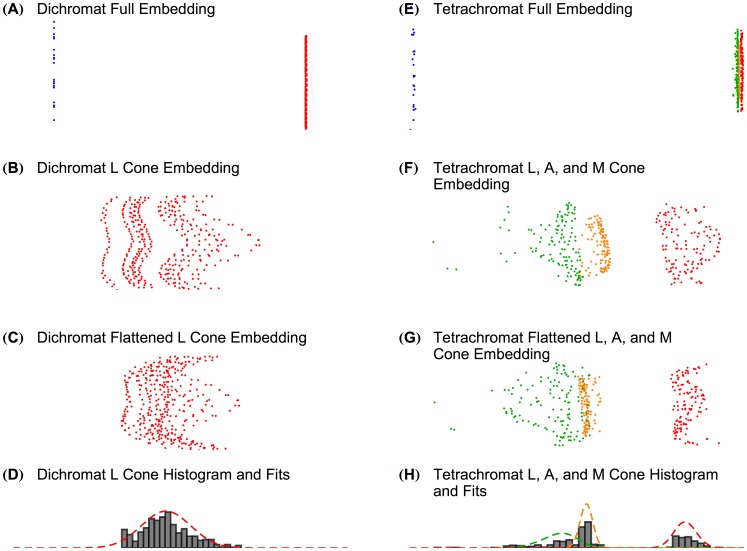
Figure 5. The algorithm detects dichromatic and tetrachromatic retinal mosaics.
On the left are embeddings of the dichromatic retinal mosaic: (A) the full embedding; (B) the embedding zoomed in on just the L cones; (C) the flattened L cone embedding; and (D) a histogram of the  positions of the flattened L cone embedding with the best-fit of the single detected skew normal. On the right are embeddings of the tetrachromatic retinal mosaic: (E) the full embedding; (F) the embedding zoomed in on just the L, M, and anomalous (A) cones; (G) the flattened L, M, and A cone embedding; and (H) a histogram of the
  coordinates of the flattened L, M, and A cone embedding with best fit of a mixture of the detected skew normals. Note that the units on Panels A, B, C, E, F, and G are arbitrary, as MDS does not produce meaningful units, but rather yields a relative-distance-preserving embedding. Spectral sensitivity curves for L, M, and S cones are shown in Figure 2A. Anomalous A cones were given
  values of 545 nm, and the tetrachromatic retinal mosaic had an L∶M∶A ratio of 1∶1∶1. L, A, M, and S cones are colored red, yellow, green, and blue, respectively.

