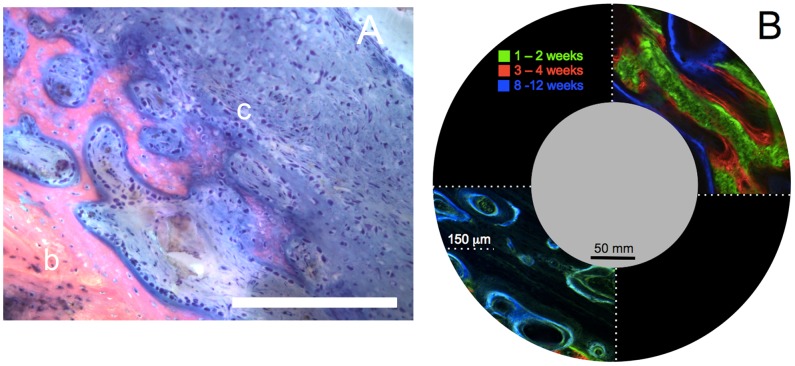
Figure 13. Spatiotemporal assessment of endochondral ossification.
Although from different experimental cohorts, the time course of endochondral ossification observed as a gradient of green to red in the right hand case study in (B) can be tied to the spatial gradient of mineralization observed as a gradient from pink to blue in (A). (A) Endochondral ossification of cartilage template (c) to bone (b) by osteoblasts seen as the densely blue-staining rounded cells lining the interface of mineralized tissue and cartilage. Staining of histological specimens enables quantitative assessment of ECM outcome and cell density at a given time in the healing process. Chondrocytes are present in the cartilage matrix, and appear more irregularly shaped. Scale bar = 100 µm. (B) Spatial and temporal aspects of defect filling via cellular tissue genesis. Insets in upper right and lower left quadrants (note length scale compared to length scale of defect and IM nail) depict temporal bone formation through visualization of fluorochromes, which chelate to mineral as the ECM is mineralized. The upper right quadrant shows the case study in which patent periosteum is sutured in situ around the defect; direct intramembranous bone formation (rapid mineralization of callus) is observed within two weeks (green), and subsequent osteoblastic bone formation (red, blue) occurs via lamellar apposition. The lower left quadrant demonstrates a case in which bone graft is packed in the defect before suturing of patent periosteum around the defect; bone remodeling is observed in the graft-filled defect zone (blue, green) and endochondral bone formation is observed between the underside of the periosteum and the outer edge of the packed bone graft (not shown). Cf. [18] for original micrographs showing full field of view.

