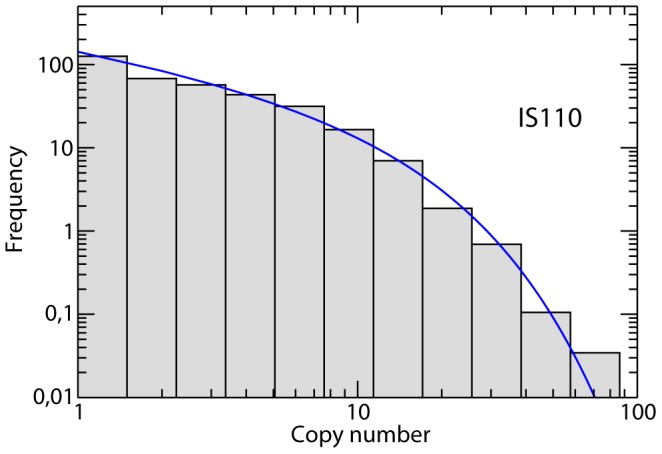
Figure 2. Model fit to the IS110 abundance distribution.

The histogram is the empirical distribution obtained from the genomic data; the blue line is the fit to the neutral model. For this IS family, the model with selection provides a fit as good as that of the neutral model. The estimated parameters are  ,
,  (goodness of fit
  ).
).
