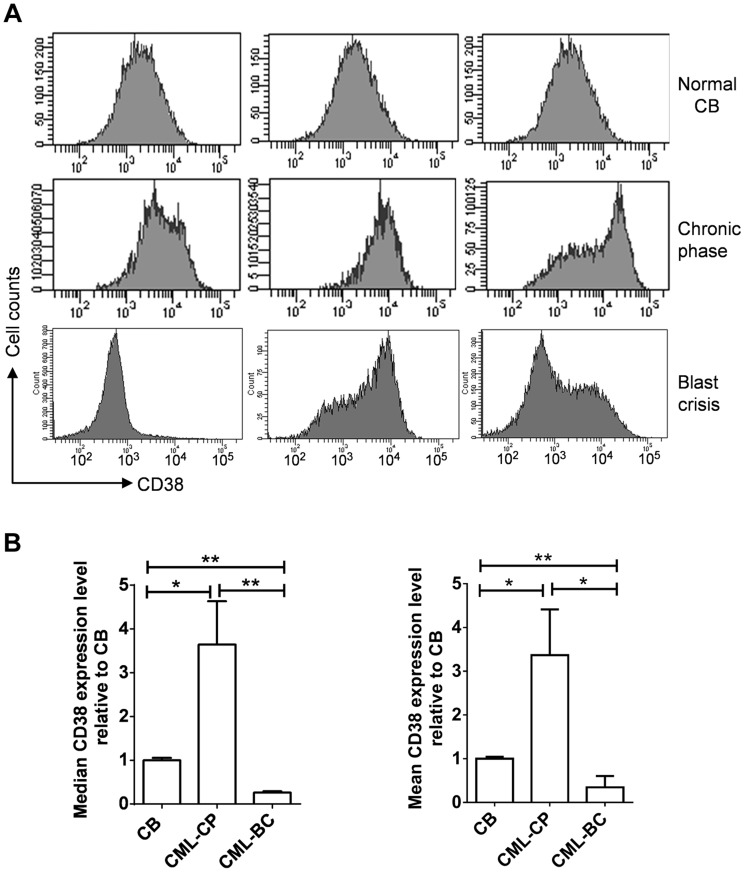
Figure 10. CD38 expression in primary CD34+ normal and CML progenitor cells.
(A) Flow cytometry plots showing CD38 expression in CD34+ cells isolated from normal cord blood (CB), chronic phase (CP) CML and blast crisis (BC) CML. Three independent samples from each group were shown. (B) Comparison of mean and median CD38 levels in A after normalization to CB samples. Statistically significant difference was indicated by asterisks.

