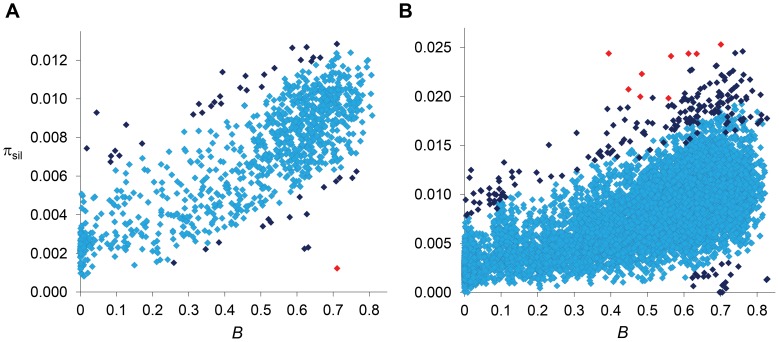
Figure 6. Relationship between estimates of B and πsil.
(A) Relationship between estimates of B and πsil for 100-kb autosomal regions. Spearman's ρ = 0.770 (1,189 regions, P<1×10⁻¹²). (B) Relationship between estimates of B and πsil for 10-kb autosomal regions. Spearman's ρ = 0.678 (8,883 regions, P<1×10⁻¹²). Dark blue and red diamonds indicate regions with πsil significantly different (higher or lower) than predicted based on residual analysis: dark blue (P<0.01), red (FDR-corrected q<0.10). Results shown for the default model MLN,StdMut,CO+GC.

