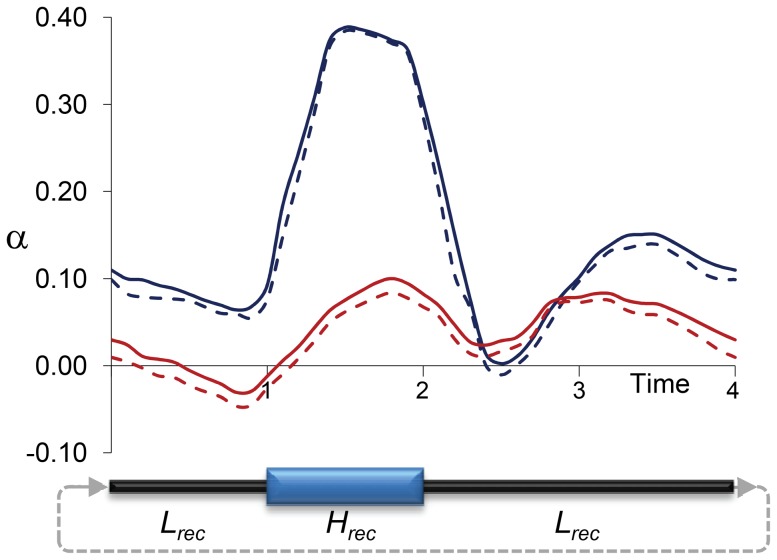
Figure 7. Estimates of α due to temporally fluctuating recombination rates and variable BGS effects.
Results based on forward population genetic simulations of 10,000 diploid individuals (N), a chromosome segment of 1 Mb containing 100 genes, and two types of mutations: neutral and deleterious (see Materials and Methods for details). Cycles of fluctuating recombination followed phases of moderately high recombination for 1N generations (H rec phase) and moderately low recombination for 3N generations (L rec phase). Estimates of α at negatively selected sites obtained following the models proposed by Eyre-Walker and Keightley [91], [95] every 0.1N generations. Blue and red lines indicate estimates of α assuming constant population size and variable population sizes, respectively. Continuous and dashed lines indicate estimates of α with and without correction for the effect of polymorphism to divergence, respectively.

