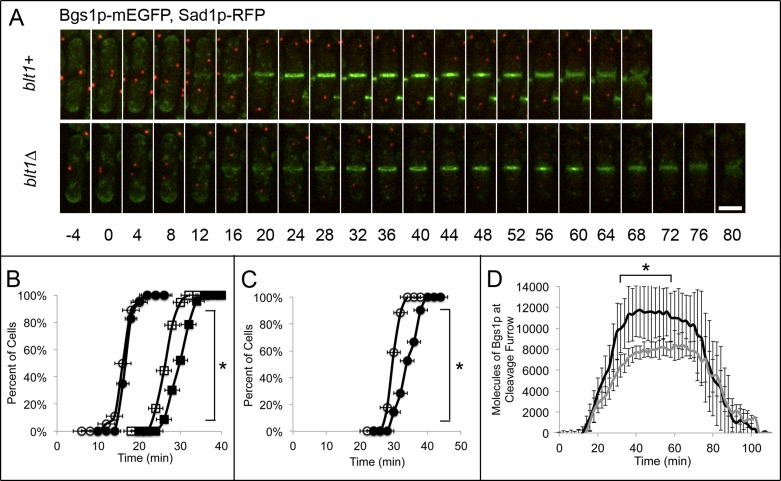
FIGURE 6:
Primary septum assembly is delayed in blt1∆ mutants. Times are in minutes, with spindle pole body separation at time zero. (A) Time series of fluorescence micrographs at 4-min intervals of wild-type (blt1+, top) or blt1∆ (bottom) cells expressing Bgs1p-mEGFP (green) and Sad1p-RFP (red). (B, C) Comparisons of wild-type (open symbols) and blt1∆ (filled symbols) cells. (B) Time courses of ( ,
,  ) the accumulation of cells with diffuse localization of Bgs1p-mEGFP ±1 SD around the equator (12 min in the blt1+ cell in A) and (
 ,
,  ) accumulation of cells with Bgs1p-mEGFP ±1 SD condensed into a ring at the site of primary septum formation (as shown in the blt1+ cell in A at 24 min) in 33 wild-type cells and 36 blt1∆ cells. Asterisks indicate time points at which the mean values of the two cell types differed with p < 0.0003. (C) Time courses of the onset of primary septum assembly ±1 SD in (
 ) 33 wild-type and (
 ) 36 blt1∆ cells. Asterisks indicate time points at which the mean values of the two cell types differed with p < 0.0001. (D) Time course of the mean number ±1 SD of Bgs1p-mEGFP molecules at the cleavage furrow in 20 wild-type cells (black line) and 21 blt1∆ cells (gray line). Asterisks indicate time points at which the mean values of the two cell types differed with p < 0.0001. Scale bar, 5 μm.

