FIGURE 1:
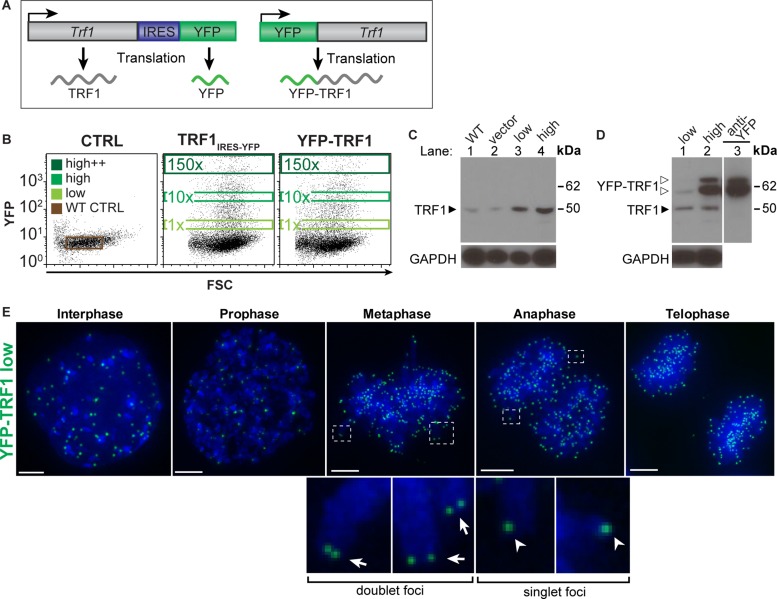
Generating cell populations expressing defined TRF1 protein levels. (A) Schematic of constructs encoding YFP-TRF1 (top) and TRF1 translated separately from YFP (bottom), driven by a CAG promoter. (B) FACS plots showing wild-type control, vector control (IRES-YFP), TRF1IRES-YFP, and YFP-TRF1 transfected cells at 24 h posttransfection and gates used to sort negative, low, high, and high++ YFP populations. Numbers in gates indicate fold difference in median YFP levels compared with the low population. (C) Western blot analysis of wild-type control, vector control (IRES-YFP), and TRF1IRES-YFP low and high sorted cell populations (lanes 1–4, respectively) and (D) YFP-TRF1 low (lane 1) and high (lane 2) sorted cell populations using anti-TRF1 antibody or anti-YFP antibody (D, lane 3). Bottom, GAPDH loading control. The molecular weights of TRF1 (solid arrowhead) and YFP-TRF1 (open arrowheads) are indicated. (E) Localization of low YFP-TRF1 (green) over the cell cycle with DAPI DNA stain (blue). Foci doublets in metaphase (insets, arrows) and singlets in anaphase (insets, arrowheads). Images are maximum-intensity projections.

