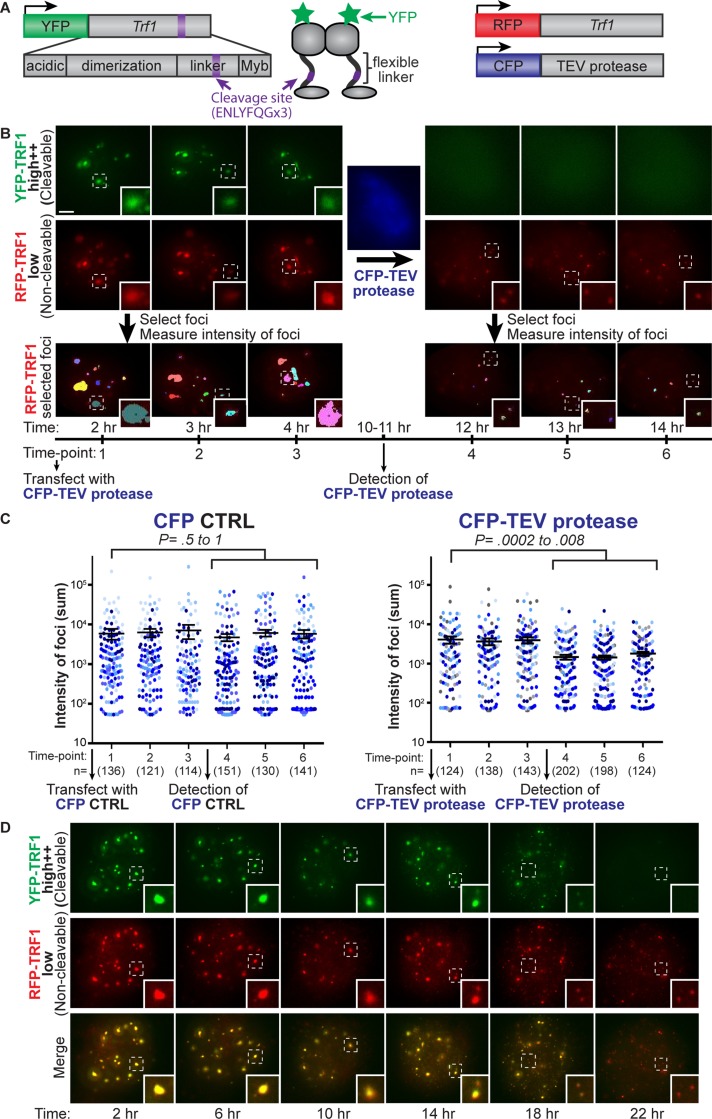
FIGURE 4:
Resolution of telomere aggregates by TRF1 cleavage. (A) Schematic of constructs for TRF1 cleavage assay: cleavable FKBP-YFP-TRF1TEV showing TRF1 domains with cleavage site (purple) inserted in flexible linker, noncleavable RFP-TRF1 to visualize telomeres, and CFP-TEV protease driven by a CAG promoter (or a PGK promoter in D). (B) Projection images of cells expressing high levels of cleavable FKBP-YFP-TRF1TEV (green) and low levels of noncleavable RFP-TRF1 (red) for three time points before and after detection of CFP-TEV protease (blue). RFP-TRF1 foci selected using automatic thresholding of fluorescence intensity (bottom), with each color representing one selected focus. (C) Column scatter plot showing average intensity of foci (sum) on a log scale for three time points before and after detection of CFP-TEV protease or CFP control, where each dot represents an individual selected focus, and each color represents an individual cell. The number of selected foci (n) for each time point is indicated in brackets. Time-lapse movies of nine and seven cells are represented for CFP-TEV protease and a CFP control, respectively (legend). The p values for T = 1 compared with T = 4–6 was calculated using an unpaired two-tailed t test. Error bars, SEM. (D) Projection images from a time-lapse movie of cells expressing high levels of cleavable FKBP-YFP-TRF1TEV (green) and low levels of noncleavable RFP-TRF1 (red) upon transfection with PGK-CFP-TEV protease, showing time after transfection. Note that FKBP-YFP-TRF1TEV fluorescence becomes diffuse (indicating that cleavage has occurred), and noncleavable RFP-TRF1 aggregates become smaller and more uniform (insets; see Supplemental Movie S4). Scale bar, 5 μm.

