FIGURE 7:
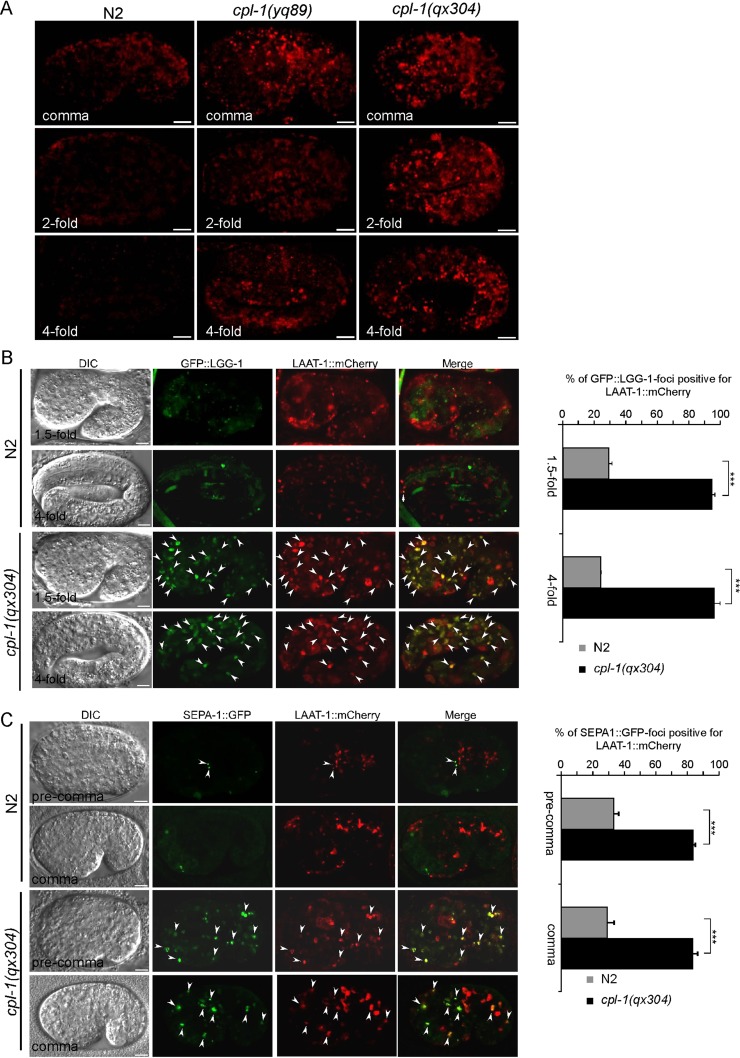
Loss of cpl-1 function impaired lysosomal degradation of endocytic and autophagic cargoes. (A) Immunostaining of yolk in embryos of N2, cpl-1(yq89) and cpl-1(qx304) embryos. Embryos of comma, twofold, and fourfold stages are shown for each genotype. Bars, 5 μm. (B) Representative images of DIC, GFP::LGG-1, and LAAT-1::mCherry and merged images of GFP::LGG-1 and LAAT-1::mCherry in N2 and cpl-1(qx304) embryos. A 1.5- and 4-fold embryo are shown for both N2 and cpl-1(qx304) mutants. Arrowheads indicate some of the foci with GFP::LGG-1 and LAAT-1::mCherry colocalization. Bars, 5 μm. Right, quantification of colocalization of GFP::LGG-1 with LAAT-1::mCherry. (C) Representative images of DIC, SEPA-1::GFP, and LAAT-1::mCherry and merged images of SEPA-1::GFP with LAAT-1::mCherry of N2 and cpl-1(qx304) animals. A precomma and a comma embryo are shown for both N2 and cpl-1(qx304) mutants. Arrowheads indicate some of the foci with SEPA-1::GFP and LAAT-1::mCherry colocalization. Bars, 5 μm. Right, quantification of colocalization of SEPA-1::GFP with LAAT-1::mCherry. All animals were raised at 25°C for analysis. In B, right, and C, right, three embryos were analyzed at each developmental stage for each genotype. Comparisons were performed using an unpaired t test. ***p < 0.001.

