
Figure 1. A) Population fitness and B) fitness variance in the recombining and non-recombining populations over time.
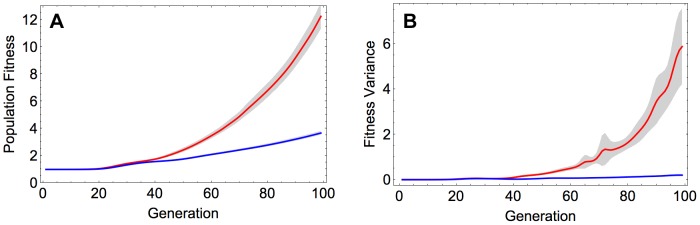
Red and blue curves correspond to the mean value across 100 simulations in the recombining and non-recombining settings, respectively. Fitness and fitness variance values are normalized with the fitness of the reference sequence. The shaded regions show 95% confidence intervals. Parameters take values: 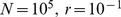 and
and  .
.