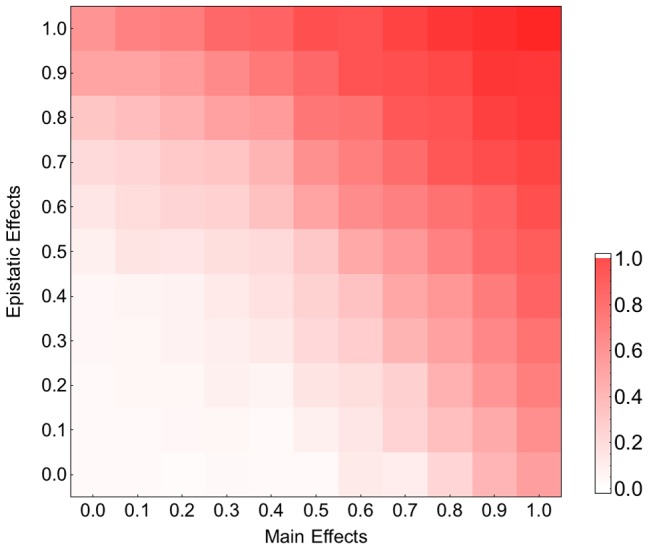
Figure 3. Contribution of the main and epistatic effects to the recombination effect on adaptation on the HIV-1 fitness landscape.

The x and y axes show the values of the constants by which the elements of the main and epistatic effects, respectively, are multiplied in the hierarchical fitness landscape. The plot shows the logarithm (base 10) of the ratio of mean fitness of the recombining to that of the non-recombining populations at generation 100, averaged across 100 simulations. Parameters take values:  and
and  .
.
