
Figure 2. Averaged psychophysical response (N = 12) in MCI and HC groups.
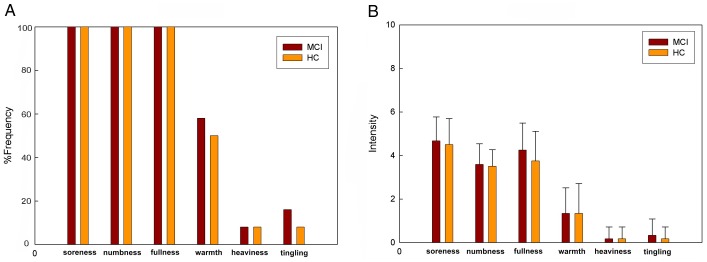
A: The percentage of subjects who reported having experienced the given sensation (at least one subject experienced the six sensations listed). B: The intensity of reported sensations measured by an average score (with standard error bars) on a scale from 0 denoting no sensation to 10 denoting an unbearable sensation.