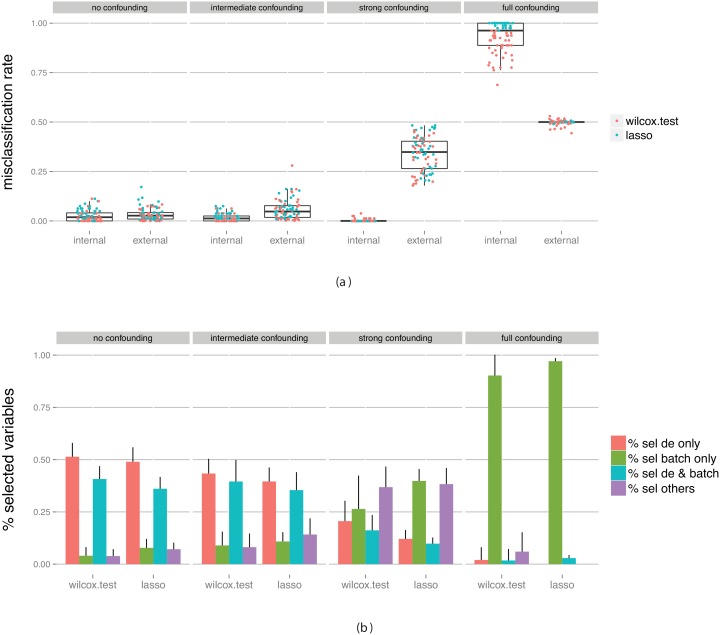
Figure 7. Evaluation of classifiers built on data containing truly differentially expressed genes between the classes, as well as a batch effect with various degree of confounding with the class labels, after the elimination of this batch effect with ComBat.
(a) Estimated predictive performance from the outer cross-validation (internal) and obtained by applying the constructed classifier to an external test set (external). (b) The fraction of predictor variables selected for the final classifier that were simulated to be differentially expressed and/or associated with the batch. The bars summarize results across all classifiers and all data set replicates. The bar heights represent the average fraction of variables extracted from each category, and the error bars extend one standard deviation above the average.

