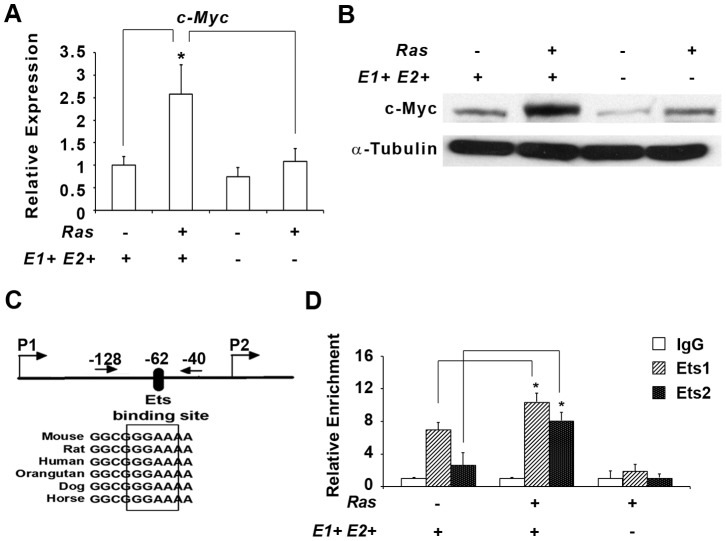
Figure 2. Ets1 and Ets2 activate c-Myc expression in HrasG12V transformed MEFs.
A) Fold change of c-Myc gene expression by real time rt-PCR in the 4 different genetic groups examined. B) Western blotting analysis of 20 µg protein lysates probed with antibodies against MYC and α-tubulin. C) Schematic illustration of the c-Myc promoter showing conserved Ets binding sites (box) and the ChIP primers used (arrows) relative to the P2 promoter. D) ChIP performed on MEFs with indicated genotypes using anti-ETS1 and ETS2 antibodies with IgG as control. The threshold value for the promoter being studied was normalized to that of input values and represented as relative enrichment. Asterisk indicates P<0.05.

