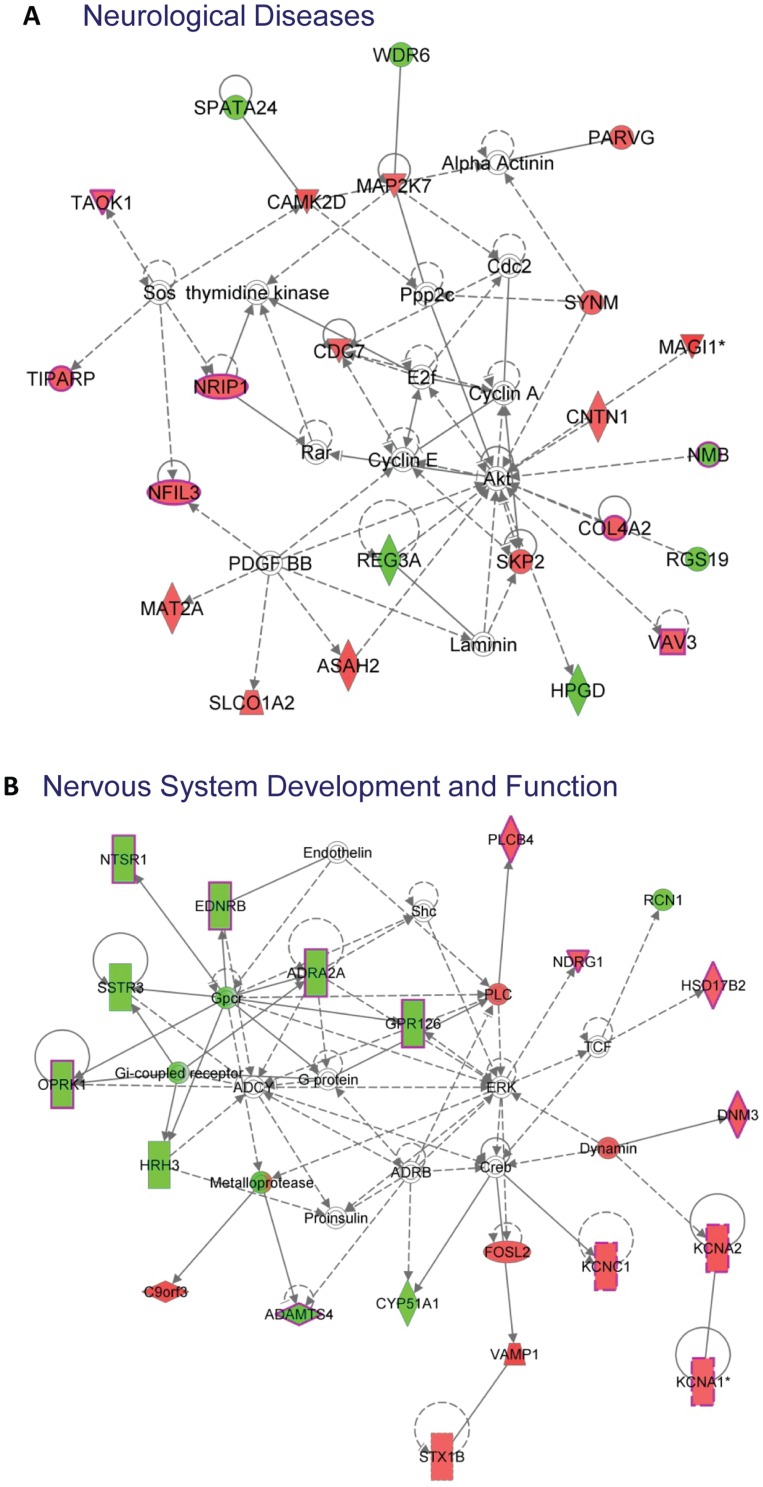
Figure 3. Ingenuity Pathway Analysis showing the two top networks restored by VPA in MeCP2 KO brains.
The 310 gene restrored by VPA in MeCP2 KO brains are mostly categorized into two networks: Neurological Disease network (A) and Nervous System Development and Function network (B). The colors indicate the direction of gene changes. Red, KO is higher than WT. Green, KO is lower than WT. The shapes of the boxes represent the functional categories of the genes. Inverted triangle: Kinase; Horizontally oval: Transcription Regulator, Vertical diamond: Enzyme, Square: Cytokine; Circle: Other; Bordered circle: Complex/Group, Vertically rectangle: G-protein Coupled Receptor; Horizontally diamond: Peptidase, Triangle: Phospatase.

