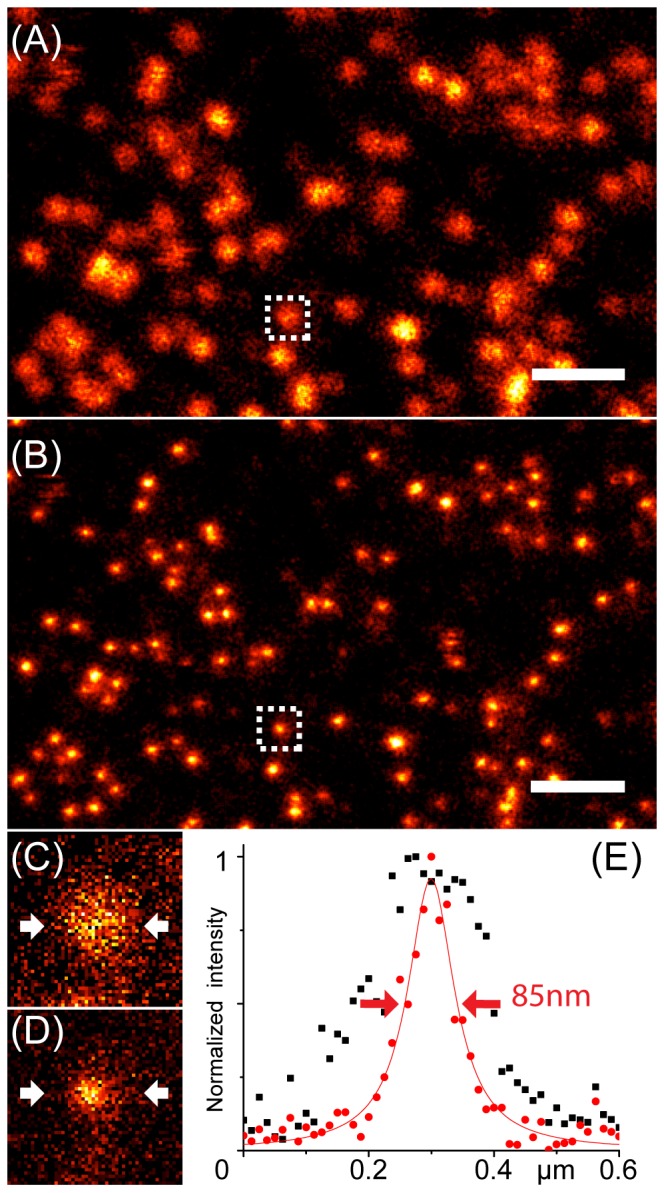
Figure 1. Confocal (A) and STED (B) images of YFP-CLPs entrapped in acrylamide gel.

Scale bar: 1 µm. Zoom on the single YFP-CLP enclosed in the white dotted square is reported in panel C (confocal) and (D) STED. Plot (E) shows the pixel intensity distribution along a horizontal line crossing the single YFP-CLP of images (C) and (D) and passing through its center; the intensity vs. distance distributions of confocal and STED acquisitions were fitted to Gaussian curves and the calculated Full Width at Half Maximum values were taken as spatial resolutions of the two methods.
