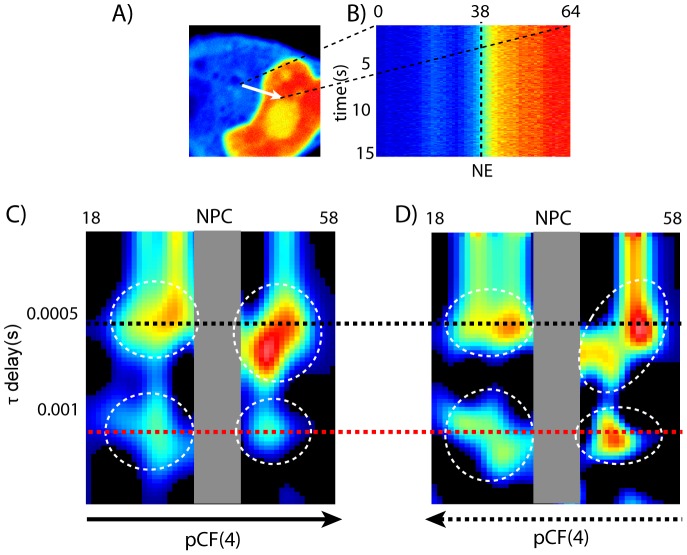
Figure 5. STED-pCF analysis of NLS-GFP in cells.
(A) Fluorescence intensity image of a cell expressing NLS-GFP: the nuclear accumulation is clearly visible. (B) Fluorescence intensity carpet in which the x-coordinate corresponds to the pixels along the scanned line (denoted as an arrow in A) and the y-coordinate corresponds to the time of acquisition (seconds). pCF(4) carpets obtained along the N→C (C) and C→N (D) directions.

