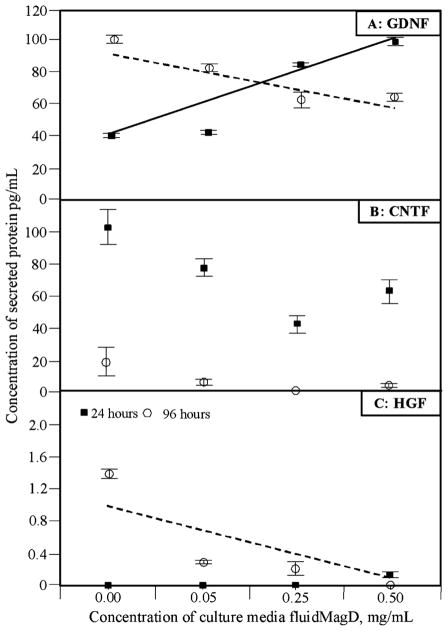
Fig. 1.
ELISA assay results from culture media of rat MSCs. Untreated cells were compared with cells cultured with either: 0.05 mg/mL; 0.25 mg/mL; or 0.5 mg/mL fluidMAG-D. Measurements were undertaken after 24 h and 96 h. Measurements obtained for—(A): GDNF (glial-derived neurotrophic factor); (B): CNTF (ciliary neurotrophic factor); and (C): HGF (hepatocyte growth factor). Each data point represents the mean value (n = 6) ± standard error of the mean. Lines correspond to the best fit regression line at 24 (solid line) and 96 h (dashed line) that were statistically significant.

