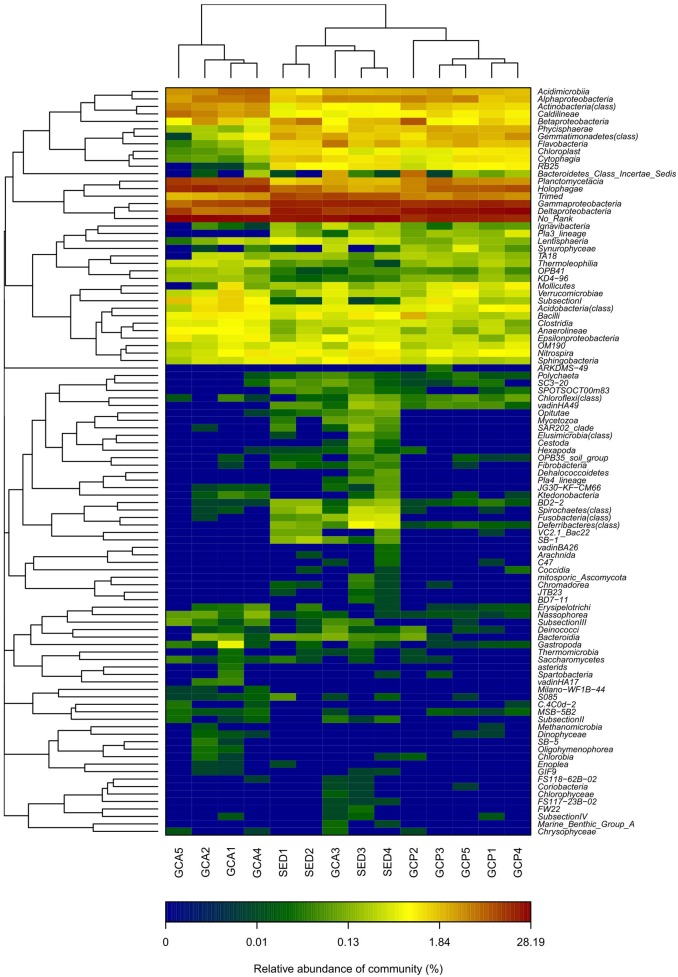
Figure 5. Hierarchically clustered heatmap of the bacterial distribution of different communities.
Double hierarchical dendrogram shows the bacterial distribution. The bacterial phylogenetic tree was calculated using the neighbor-joining method and the relationship among samples was determined by Bray-Curtis distance and the complete clustering method. The heatmap plot depicts the relative percentage of each bacterial class (variables clustering on the vertical-axis) within each sample (horizon-axis clustering). The relative values for bacterial class are indicated by color intensity with the legend indicated at the bottom of the figure.

