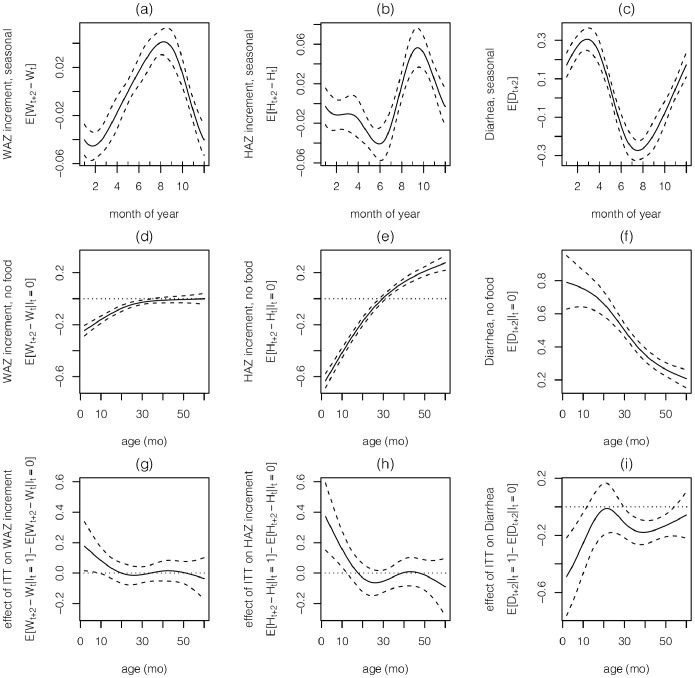
Figure 1. The estimated spline functions (and 95% confidence intervals) for boys from the GAM.
The seasonal functions (a)  , (b)
, (b)  and (c)
  for WAZ and HAZ increments and diarrhea. The age functions in the absence of supplementary food (d)
  , (e)
, (e)  and (f)
  for WAZ and HAZ increments and diarrhea. The age functions due to ITT (g)
  , (h)
, (h)  and (i)
  for WAZ and HAZ increments and diarrhea.

