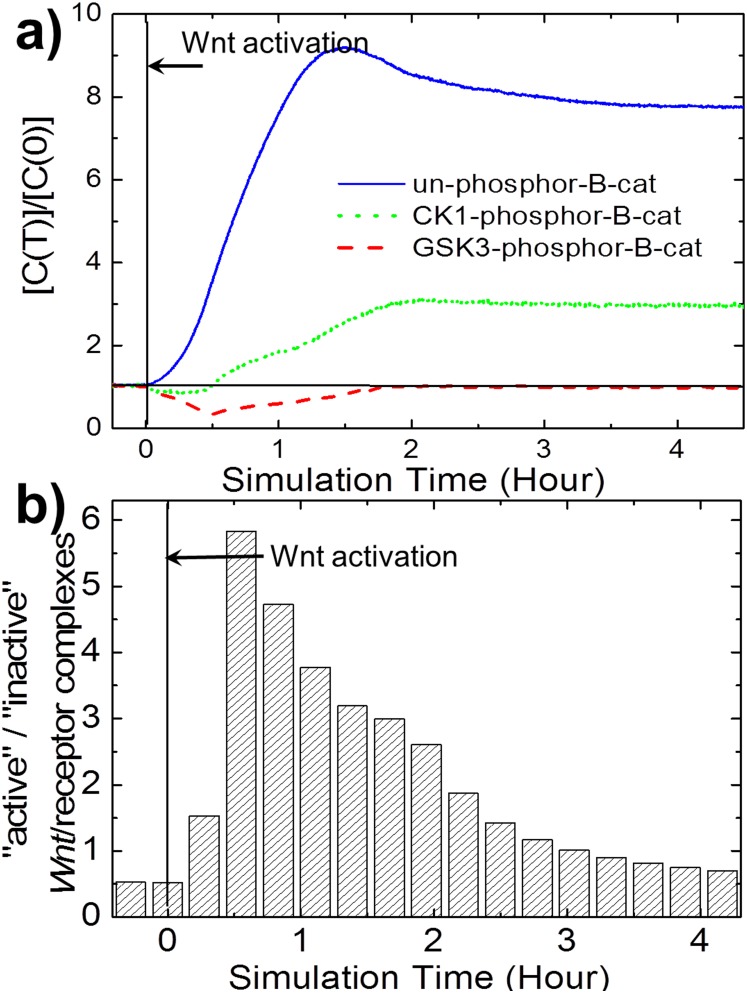
Figure 5. Calibration of Wnt stimulation and β-catenin degradation module.
Fig. 5a shows the kinetic respond of β-catenins. GSK3-phosphor-B-cat (red dash line) decreases in the first 0.5 hr then recovers to its initial level. CK1-phosphor-B-cat (green dot line) decreases in the first 0.5 hr then increases to around 3 fold of its initial level. Un-phosphorylated B-cat (blue solid line) increases to 8 fold of its initial level. Fig. 5b shows the kinetic response of Axin-bound Wnt/receptor complexes to Wnt stimulation. All curves were averaged over 50 simulation trajectories. Our model reproduced the most recent experimental phenomena with semi-quantitative accuracy.

