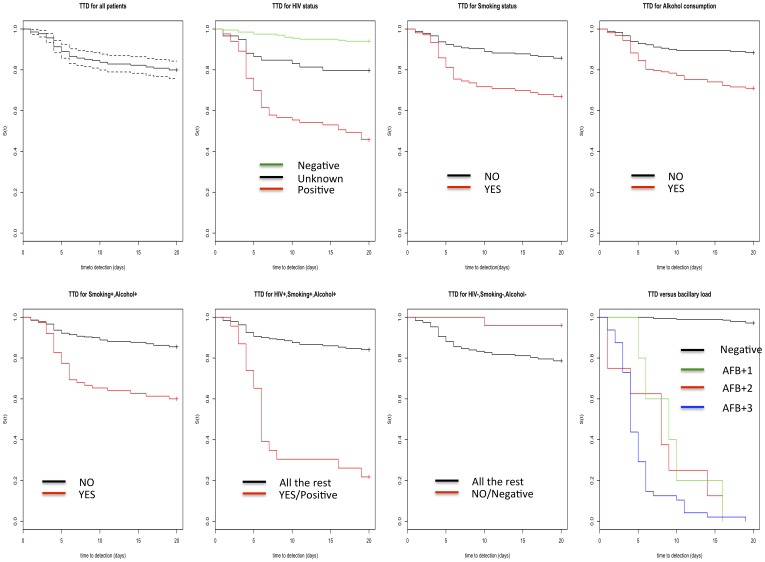
Figure 2. Kaplan-Meier plots showing the Time to detection (TTD) of bacilli on MGIT960 (Y-axis = s(t) which is the survival function, X-axis is the TTD in days).
Top row first graph shows the time to detection of all the 344 patients without any covariate structure considered. Second, third and fourth show the TTD when HIV status, Smoking and alcohol consumption are considered as covariates respectively. Bottom row: The first, second, third and fourth graph show the TTD for the combination of (patients who consume alcohol and smoke), (patients who smoke, consume alcohol and are HIV positive), (HIV negative patients who neither consume alcohol nor smoke) and bacillary load levels respectively.

