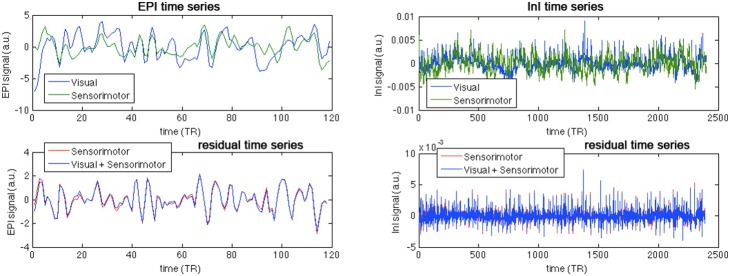
Figure 4. The EPI (left column) and InI (right column) time series at the visual and sensorimotor cortices from a representative subject (top panel) and the residual EPI (left column) and InI (right column) time series at the sensorimotor cortex after AR modeling using the sensorimotor cortex time series alone and both sensorimotor and visual cortices (bottom panel).