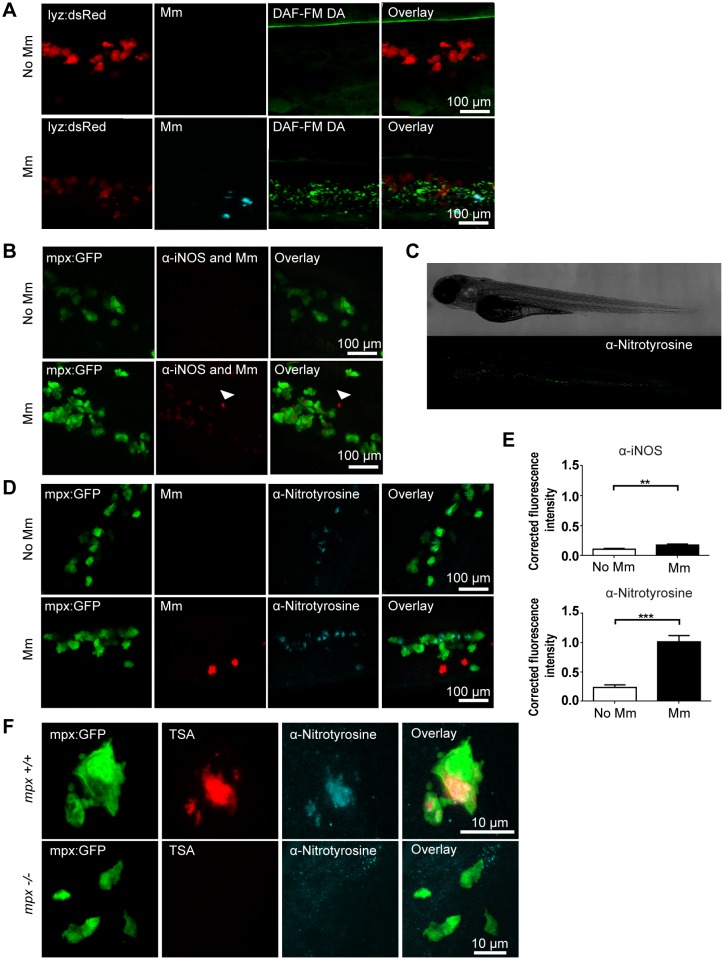
Figure 1. Tyrosine nitration is a quantifiable measure of nitration output during early Mm infection.
(A) Confocal micrographs of DAF-FM DA stained embryos at 1 day post infection (dpi) in the caudal vein region. Neutrophils are shown by lyz driven dsRed. Upper panels show an example of an uninfected embryo while lower panels show an infected embryo. N.b. The bright stripe of DAF-FM DA staining in the upper panels is the notochord, which has variable brightness when focusing on the caudal vein region due to differences in embryo mounting. (B) Confocal micrographs of 1 dpi embryos stained with iNOS antibody (dim red) when infected with Mm (bright red, white arrow) or non-infected. Neutrophils are shown by mpx:GFP. (C) Fluorescence micrographs of confocal images stitched together to show the location of anti-nitrotyrosine staining in a whole-mount wild type zebrafish embryo of 3 dpf. (D) Confocal fluorescence micrographs of 1 dpi embryos showing the co-localization of mpx:GFP and anti-nitrotyrosine antibody staining in the absence or presence of Mm infection. (E) Corrected fluorescence intensity measurements of antibody stainings in the absence or presence of Mm. Upper panel shows the levels for the iNOS antibody shown in (B). Data shown are mean ± SEM, n = 45 cells from 15 embryos combined from 3 independent experiments. Lower panel shows the levels for the anti-nitrotyrosine antibody shown in D). Data shown are mean ± SEM, n = 58–99 cells from 15 embryos combined from 3 independent experiments. (F) Confocal micrographs showing co-localization of nitrotyrosine with compartments of neutrophils with myeloperoxidase activity (shown by TSA staining, in the absence of infection at 2 dpf. In the mpx−/− mutant there is no myeloperoxidase activity and a corresponding decrease in nitrotyrosine.

