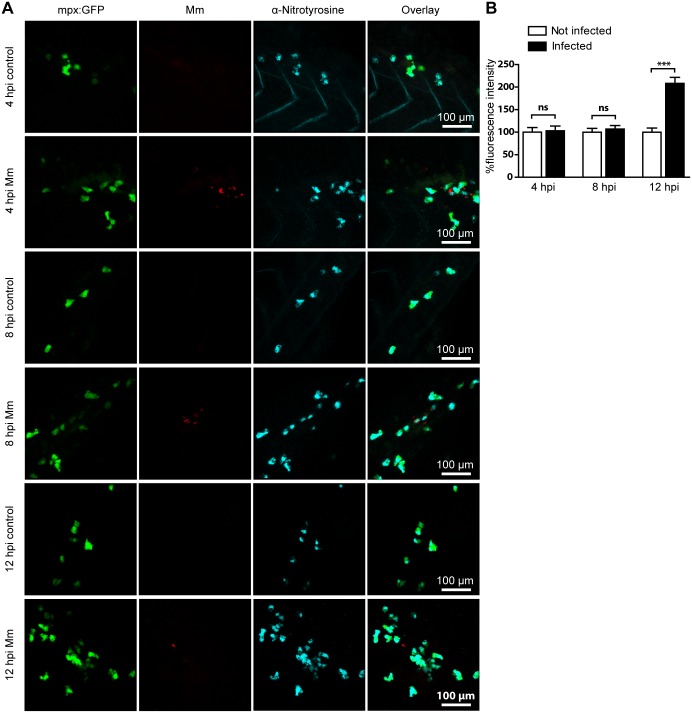
Figure 2. Mm infection increased tyrosine nitration levels at 12 hpi.
(A) Example fluorescence confocal z-stacks of the caudal vein region of embryos stained with anti-nitrotyrosine antibody, imaged at 4, 8 or 12 hpi in the presence or absence of Mm infection. (B) Corrected fluorescence intensity levels of anti-nitrotyrosine antibody confocal z-stacks of equal size at 4, 8 or 12 hours after Mm infection relative to the control group per time point. Data shown are mean ± SEM, n = 50–85 cells from 15 embryos combined from 3 independent experiments.

