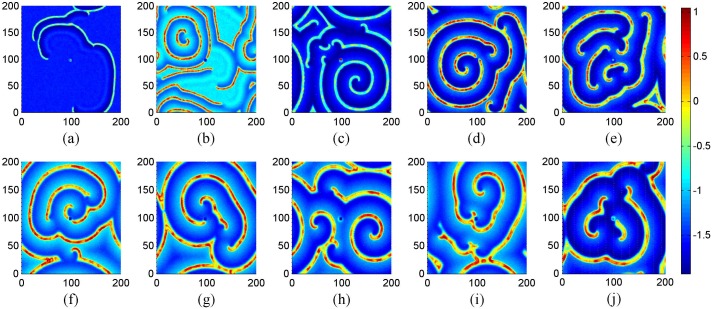
Figure 7. The developed states at t = 16000 time units in the network of neurons under different coupling intensities.
For coupling intensity (a) D = 0.4, (b) D = 0.5, (c) D = 0.6, (d) D = 0.7, (e) D = 0.8, (f) D = 0.9, (g) D = 1.1, (h) D = 1.2, (i) D = 1.3, (j) D = 1.5. Where g = −1.5, τ = 30, Iext = 1.0, D 0 = 0.01 and periodical boundary condition is used.

